
 Yahoo Finance
 PS Business Parks (PSB) Q1 FFO Lags Estimates, Revenues Up Y/Y

PS Business Parks Inc. PSB reported first-quarter 2022 core funds from operations (FFO) per share of $1.82, up 9% year over year. However, the figure marginally lagged the Zacks Consensus Estimate of $1.84.
PSB’s quarterly results reflect higher same-park cash net operating income (NOI) backed by increase in weighted average occupancy.
The total rental income came in at $112.8 million, marginally beating the Zacks Consensus Estimate of $110.1 million. The figure increased 4.4% year over year.
As of Mar 31, 2022, PS Business Parks had 307 current customers who had received rent relief, accounting for 9.6% of rental income. Also, to this date, the company had collected $5.4 million of rent deferral repayment, representing 99.8% of the amounts scheduled to be repaid through Mar 31, 2022.
On Apr 25, 2022, PS Business Parks entered into an agreement with Blackstone Real Estate whereby the latter will be acquiring all of PSB’s outstanding common shares for $187.50 per share. This all-cash transaction is valued at around $7.6 billion.
Quarter in Detail
The same-park rental income increased 7.1% year over year to $105.0 million, while same-park NOI grew 7.7% to $74.1 million. The same-park cash rental income per occupied square foot increased 4.6%, while cash NOI grew 8.6% year over year.
The same-park revenue per occupied square foot climbed 4.1% to $16.99. In addition, the same-park weighted average square foot occupancy increased from 93.3% to 96% year over year during first-quarter 2022.
During the March-end quarter, PS Business Parks executed leases on 1.7 million square feet compared with 1.9 million in the prior-year quarter. The cash rental rate growth was 10.7%.
The average lease term of all the leases executed during the quarter was 3.5 years, with associated average transaction costs (tenant improvements and leasing commissions) of $3.22 per square foot. This compares with the average lease term and transaction costs on leases executed of 3.3 years and $2.58 per square foot, respectively, in the prior-year period.
In the quarter, the company sold the Royal Tech Business Park, a 702,000 square foot industrial-flex business park located in Irving, TX, for net sale proceeds of $91.9 million.
Liquidity
PS Business Parks exited first-quarter 2022 with cash and cash equivalents of $104.2 million, up from $27.1 million reported as of Dec 31, 2021.
As of Mar 31, 2022, the company had $20 million outstanding on its credit facility. PSB’s credit facility expires in August 2025.
Dividend Update
On Apr 29, 2022, the company’s board of directors announced a quarterly dividend of $1.05 per share. The dividend will be paid out on Jun 30 to shareholders on record as of Jun 15, 2022.
PS Business Parks currently carries a Zacks Rank #4 (Sell).
You can see the complete list of today’s Zacks #1 Rank (Strong Buy) stocks here.
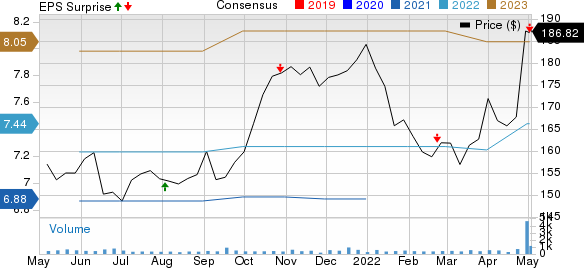
PS Business Parks, Inc. Price, Consensus and EPS Surprise
PS Business Parks, Inc. price-consensus-eps-surprise-chart | PS Business Parks, Inc. Quote
Performance of Other REITs
Cousins Properties Incorporated’s CUZ first-quarter 2022 FFO per share of 67 cents came in line with the Zacks Consensus Estimate.
Total revenues aggregated $186.9 million, exceeding the Zacks Consensus Estimate of $184.7 million.
On a year-over-year basis, CUZ’s FFO per share and total revenues declined 2.9% and 1.4%, respectively.
The slight growth in revenue was offset by a rise in operating expenses during the first-quarter. Leasing activity fell year-over-year.
Mid-America Apartment Communities, Inc. MAA, commonly referred to as MAA, reported first-quarter 2022 core FFO per share of $1.97, surpassing the Zacks Consensus Estimate of $1.92. The reported number increased 20.1% year over year.
MAA’s quarterly results were driven by an increase in the average effective rent per unit for the same-store portfolio. The average physical occupancy for the same-store portfolio also increased year over year.
The rental and other property revenues came in at $476.1 million, outpacing the Zacks Consensus Estimate of $474.2 million. The reported figure was 12% higher than the previous-year quarter’s $425 million.
AvalonBay Communities, Inc.’s AVB first-quarter 2022 core FFO per share of $2.26 matched the Zacks Consensus Estimate.
However, total revenues of $613.9 million lagged the consensus estimate of $615.4 million.
On a year-over-year basis, AVB’s core FFO per share increased 15.9% and total revenues grew 11.4%.
The first-quarter results reflected a year-over-year increase in same-store residential revenues, partially offset by rising operating expenses.
Note: Anything related to earnings presented in this write-up represent funds from operations (FFO) — a widely used metric to gauge the performance of REITs.
Want the latest recommendations from Zacks Investment Research? Today, you can download 7 Best Stocks for the Next 30 Days. Click to get this free report
AvalonBay Communities, Inc. (AVB) : Free Stock Analysis Report
Cousins Properties Incorporated (CUZ) : Free Stock Analysis Report
MidAmerica Apartment Communities, Inc. (MAA) : Free Stock Analysis Report
PS Business Parks, Inc. (PSB) : Free Stock Analysis Report
To read this article on Zacks.com click here.
