
 Yahoo Finance
 Pulling back 3.8% this week, PVH's NYSE:PVH) three-year decline in earnings may be coming into investors focus
By buying an index fund, investors can approximate the average market return. But many of us dare to dream of bigger returns, and build a portfolio ourselves. Just take a look at PVH Corp. (NYSE:PVH), which is up 65%, over three years, soundly beating the market return of 38% (not including dividends). On the other hand, the returns haven't been quite so good recently, with shareholders up just 15% , including dividends .
While this past week has detracted from the company's three-year return, let's look at the recent trends of the underlying business and see if the gains have been in alignment.
See our latest analysis for PVH
In his essay The Superinvestors of Graham-and-Doddsville Warren Buffett described how share prices do not always rationally reflect the value of a business. By comparing earnings per share (EPS) and share price changes over time, we can get a feel for how investor attitudes to a company have morphed over time.
During the three years of share price growth, PVH actually saw its earnings per share (EPS) drop 17% per year.
This means it's unlikely the market is judging the company based on earnings growth. Therefore, we think it's worth considering other metrics as well.
The modest 0.2% dividend yield is unlikely to be propping up the share price. Do you think that shareholders are buying for the 2.1% per annum revenue growth trend? We don't. While we don't have an obvious theory to explain the share price rise, a closer look at the data might be enlightening.
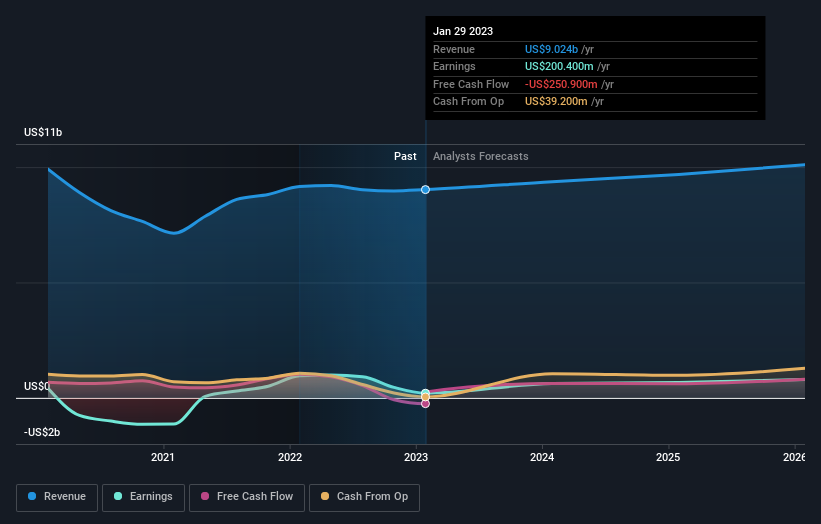
The graphic below depicts how earnings and revenue have changed over time (unveil the exact values by clicking on the image).
We consider it positive that insiders have made significant purchases in the last year. Even so, future earnings will be far more important to whether current shareholders make money. So we recommend checking out this free report showing consensus forecasts
A Different Perspective
It's nice to see that PVH shareholders have received a total shareholder return of 15% over the last year. And that does include the dividend. Notably the five-year annualised TSR loss of 8% per year compares very unfavourably with the recent share price performance. The long term loss makes us cautious, but the short term TSR gain certainly hints at a brighter future. I find it very interesting to look at share price over the long term as a proxy for business performance. But to truly gain insight, we need to consider other information, too. Take risks, for example - PVH has 2 warning signs we think you should be aware of.
There are plenty of other companies that have insiders buying up shares. You probably do not want to miss this free list of growing companies that insiders are buying.
Please note, the market returns quoted in this article reflect the market weighted average returns of stocks that currently trade on American exchanges.
Have feedback on this article? Concerned about the content? Get in touch with us directly. Alternatively, email editorial-team (at) simplywallst.com.
This article by Simply Wall St is general in nature. We provide commentary based on historical data and analyst forecasts only using an unbiased methodology and our articles are not intended to be financial advice. It does not constitute a recommendation to buy or sell any stock, and does not take account of your objectives, or your financial situation. We aim to bring you long-term focused analysis driven by fundamental data. Note that our analysis may not factor in the latest price-sensitive company announcements or qualitative material. Simply Wall St has no position in any stocks mentioned.
Join A Paid User Research Session
You’ll receive a US$30 Amazon Gift card for 1 hour of your time while helping us build better investing tools for the individual investors like yourself. Sign up here
