
 Yahoo Finance
 How Do Pure Cycle Corporation’s (NASDAQ:PCYO) Returns On Capital Compare To Peers?

Want to participate in a short research study? Help shape the future of investing tools and you could win a $250 gift card!
Today we are going to look at Pure Cycle Corporation (NASDAQ:PCYO) to see whether it might be an attractive investment prospect. Specifically, we're going to calculate its Return On Capital Employed (ROCE), in the hopes of getting some insight into the business.
First of all, we'll work out how to calculate ROCE. Next, we'll compare it to others in its industry. And finally, we'll look at how its current liabilities are impacting its ROCE.
What is Return On Capital Employed (ROCE)?
ROCE measures the 'return' (pre-tax profit) a company generates from capital employed in its business. All else being equal, a better business will have a higher ROCE. In brief, it is a useful tool, but it is not without drawbacks. Author Edwin Whiting says to be careful when comparing the ROCE of different businesses, since 'No two businesses are exactly alike.'
How Do You Calculate Return On Capital Employed?
Analysts use this formula to calculate return on capital employed:
Return on Capital Employed = Earnings Before Interest and Tax (EBIT) ÷ (Total Assets - Current Liabilities)
Or for Pure Cycle:
0.0021 = US$149k ÷ (US$74m - US$3.8m) (Based on the trailing twelve months to February 2019.)
Therefore, Pure Cycle has an ROCE of 0.2%.
See our latest analysis for Pure Cycle
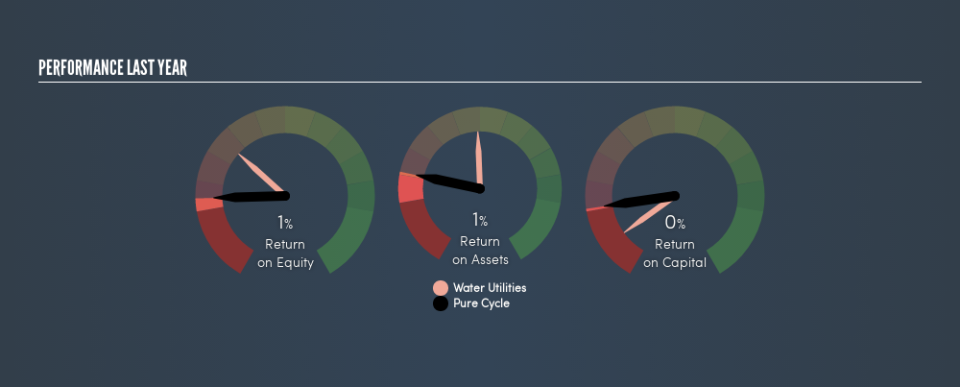
Does Pure Cycle Have A Good ROCE?
ROCE can be useful when making comparisons, such as between similar companies. Using our data, Pure Cycle's ROCE appears to be significantly below the 4.9% average in the Water Utilities industry. This performance is not ideal, as it suggests the company may not be deploying its capital as effectively as some competitors. Putting aside Pure Cycle's performance relative to its industry, its ROCE in absolute terms is poor - considering the risk of owning stocks compared to government bonds. It is likely that there are more attractive prospects out there.
Pure Cycle delivered an ROCE of 0.2%, which is better than 3 years ago, as was making losses back then. This makes us wonder if the company is improving.
It is important to remember that ROCE shows past performance, and is not necessarily predictive. Companies in cyclical industries can be difficult to understand using ROCE, as returns typically look high during boom times, and low during busts. This is because ROCE only looks at one year, instead of considering returns across a whole cycle. You can check if Pure Cycle has cyclical profits by looking at this free graph of past earnings, revenue and cash flow.
Do Pure Cycle's Current Liabilities Skew Its ROCE?
Current liabilities are short term bills and invoices that need to be paid in 12 months or less. The ROCE equation subtracts current liabilities from capital employed, so a company with a lot of current liabilities appears to have less capital employed, and a higher ROCE than otherwise. To counteract this, we check if a company has high current liabilities, relative to its total assets.
Pure Cycle has total assets of US$74m and current liabilities of US$3.8m. Therefore its current liabilities are equivalent to approximately 5.1% of its total assets. Pure Cycle has a low level of current liabilities, which have a negligible impact on its already low ROCE.
Our Take On Pure Cycle's ROCE
Still, investors could probably find more attractive prospects with better performance out there. Of course, you might also be able to find a better stock than Pure Cycle. So you may wish to see this free collection of other companies that have grown earnings strongly.
I will like Pure Cycle better if I see some big insider buys. While we wait, check out this free list of growing companies with considerable, recent, insider buying.
We aim to bring you long-term focused research analysis driven by fundamental data. Note that our analysis may not factor in the latest price-sensitive company announcements or qualitative material.
If you spot an error that warrants correction, please contact the editor at editorial-team@simplywallst.com. This article by Simply Wall St is general in nature. It does not constitute a recommendation to buy or sell any stock, and does not take account of your objectives, or your financial situation. Simply Wall St has no position in the stocks mentioned. Thank you for reading.
