
 Yahoo Finance
 Is QinetiQ Group plc’s (LON:QQ.) 13% ROCE Any Good?

Today we are going to look at QinetiQ Group plc (LON:QQ.) to see whether it might be an attractive investment prospect. To be precise, we'll consider its Return On Capital Employed (ROCE), as that will inform our view of the quality of the business.
First of all, we'll work out how to calculate ROCE. Next, we'll compare it to others in its industry. Last but not least, we'll look at what impact its current liabilities have on its ROCE.
Return On Capital Employed (ROCE): What is it?
ROCE measures the 'return' (pre-tax profit) a company generates from capital employed in its business. Generally speaking a higher ROCE is better. Overall, it is a valuable metric that has its flaws. Author Edwin Whiting says to be careful when comparing the ROCE of different businesses, since 'No two businesses are exactly alike.
So, How Do We Calculate ROCE?
Analysts use this formula to calculate return on capital employed:
Return on Capital Employed = Earnings Before Interest and Tax (EBIT) ÷ (Total Assets - Current Liabilities)
Or for QinetiQ Group:
0.13 = UK£128m ÷ (UK£1.3b - UK£327m) (Based on the trailing twelve months to September 2019.)
So, QinetiQ Group has an ROCE of 13%.
View our latest analysis for QinetiQ Group
Does QinetiQ Group Have A Good ROCE?
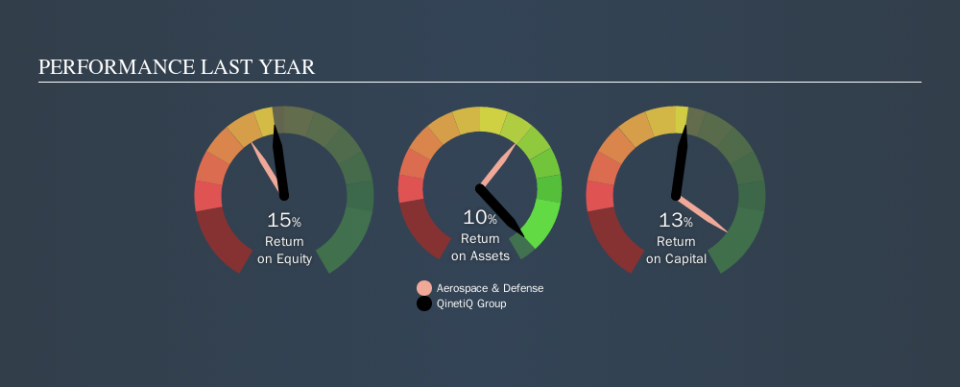
One way to assess ROCE is to compare similar companies. In our analysis, QinetiQ Group's ROCE is meaningfully higher than the 11% average in the Aerospace & Defense industry. I think that's good to see, since it implies the company is better than other companies at making the most of its capital. Regardless of where QinetiQ Group sits next to its industry, its ROCE in absolute terms appears satisfactory, and this company could be worth a closer look.
QinetiQ Group's current ROCE of 13% is lower than 3 years ago, when the company reported a 27% ROCE. So investors might consider if it has had issues recently. The image below shows how QinetiQ Group's ROCE compares to its industry, and you can click it to see more detail on its past growth.
It is important to remember that ROCE shows past performance, and is not necessarily predictive. ROCE can be deceptive for cyclical businesses, as returns can look incredible in boom times, and terribly low in downturns. ROCE is only a point-in-time measure. Future performance is what matters, and you can see analyst predictions in our free report on analyst forecasts for the company.
Do QinetiQ Group's Current Liabilities Skew Its ROCE?
Liabilities, such as supplier bills and bank overdrafts, are referred to as current liabilities if they need to be paid within 12 months. The ROCE equation subtracts current liabilities from capital employed, so a company with a lot of current liabilities appears to have less capital employed, and a higher ROCE than otherwise. To check the impact of this, we calculate if a company has high current liabilities relative to its total assets.
QinetiQ Group has total liabilities of UK£327m and total assets of UK£1.3b. As a result, its current liabilities are equal to approximately 25% of its total assets. Current liabilities are minimal, limiting the impact on ROCE.
The Bottom Line On QinetiQ Group's ROCE
This is good to see, and with a sound ROCE, QinetiQ Group could be worth a closer look. There might be better investments than QinetiQ Group out there, but you will have to work hard to find them . These promising businesses with rapidly growing earnings might be right up your alley.
If you like to buy stocks alongside management, then you might just love this free list of companies. (Hint: insiders have been buying them).
If you spot an error that warrants correction, please contact the editor at editorial-team@simplywallst.com. This article by Simply Wall St is general in nature. It does not constitute a recommendation to buy or sell any stock, and does not take account of your objectives, or your financial situation. Simply Wall St has no position in the stocks mentioned.
We aim to bring you long-term focused research analysis driven by fundamental data. Note that our analysis may not factor in the latest price-sensitive company announcements or qualitative material. Thank you for reading.
