
 Yahoo Finance
 QUIZ (LON:QUIZ) Could Be At Risk Of Shrinking As A Company
When it comes to investing, there are some useful financial metrics that can warn us when a business is potentially in trouble. Businesses in decline often have two underlying trends, firstly, a declining return on capital employed (ROCE) and a declining base of capital employed. This indicates to us that the business is not only shrinking the size of its net assets, but its returns are falling as well. In light of that, from a first glance at QUIZ (LON:QUIZ), we've spotted some signs that it could be struggling, so let's investigate.
What Is Return On Capital Employed (ROCE)?
For those who don't know, ROCE is a measure of a company's yearly pre-tax profit (its return), relative to the capital employed in the business. Analysts use this formula to calculate it for QUIZ:
Return on Capital Employed = Earnings Before Interest and Tax (EBIT) ÷ (Total Assets - Current Liabilities)
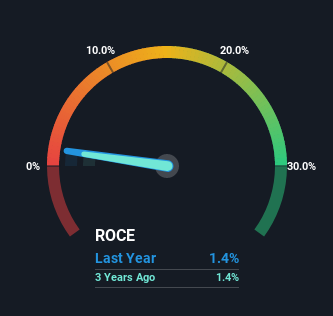
0.014 = UK£270k ÷ (UK£33m - UK£14m) (Based on the trailing twelve months to March 2022).
Therefore, QUIZ has an ROCE of 1.4%. Ultimately, that's a low return and it under-performs the Specialty Retail industry average of 14%.
Check out our latest analysis for QUIZ
In the above chart we have measured QUIZ's prior ROCE against its prior performance, but the future is arguably more important. If you'd like, you can check out the forecasts from the analysts covering QUIZ here for free.
How Are Returns Trending?
In terms of QUIZ's historical ROCE trend, it isn't fantastic. To be more specific, today's ROCE was 31% five years ago but has since fallen to 1.4%. In addition to that, QUIZ is now employing 27% less capital than it was five years ago. When you see both ROCE and capital employed diminishing, it can often be a sign of a mature and shrinking business that might be in structural decline. Typically businesses that exhibit these characteristics aren't the ones that tend to multiply over the long term, because statistically speaking, they've already gone through the growth phase of their life cycle.
On a side note, QUIZ's current liabilities are still rather high at 42% of total assets. This can bring about some risks because the company is basically operating with a rather large reliance on its suppliers or other sorts of short-term creditors. Ideally we'd like to see this reduce as that would mean fewer obligations bearing risks.
The Key Takeaway
In short, lower returns and decreasing amounts capital employed in the business doesn't fill us with confidence. This could explain why the stock has sunk a total of 94% in the last five years. Unless there is a shift to a more positive trajectory in these metrics, we would look elsewhere.
If you want to continue researching QUIZ, you might be interested to know about the 3 warning signs that our analysis has discovered.
While QUIZ isn't earning the highest return, check out this free list of companies that are earning high returns on equity with solid balance sheets.
Have feedback on this article? Concerned about the content? Get in touch with us directly. Alternatively, email editorial-team (at) simplywallst.com.
This article by Simply Wall St is general in nature. We provide commentary based on historical data and analyst forecasts only using an unbiased methodology and our articles are not intended to be financial advice. It does not constitute a recommendation to buy or sell any stock, and does not take account of your objectives, or your financial situation. We aim to bring you long-term focused analysis driven by fundamental data. Note that our analysis may not factor in the latest price-sensitive company announcements or qualitative material. Simply Wall St has no position in any stocks mentioned.
Join A Paid User Research Session
You’ll receive a US$30 Amazon Gift card for 1 hour of your time while helping us build better investing tools for the individual investors like yourself. Sign up here
