
 Yahoo Finance
 Qurate Retail (NASDAQ:QRTE.A) Is Experiencing Growth In Returns On Capital
Finding a business that has the potential to grow substantially is not easy, but it is possible if we look at a few key financial metrics. One common approach is to try and find a company with returns on capital employed (ROCE) that are increasing, in conjunction with a growing amount of capital employed. Ultimately, this demonstrates that it's a business that is reinvesting profits at increasing rates of return. So on that note, Qurate Retail (NASDAQ:QRTE.A) looks quite promising in regards to its trends of return on capital.
Understanding Return On Capital Employed (ROCE)
If you haven't worked with ROCE before, it measures the 'return' (pre-tax profit) a company generates from capital employed in its business. Analysts use this formula to calculate it for Qurate Retail:
Return on Capital Employed = Earnings Before Interest and Tax (EBIT) ÷ (Total Assets - Current Liabilities)
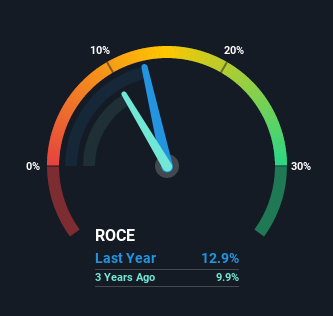
0.13 = US$1.6b ÷ (US$17b - US$4.4b) (Based on the trailing twelve months to September 2021).
Thus, Qurate Retail has an ROCE of 13%. That's a pretty standard return and it's in line with the industry average of 13%.
Check out our latest analysis for Qurate Retail
In the above chart we have measured Qurate Retail's prior ROCE against its prior performance, but the future is arguably more important. If you'd like, you can check out the forecasts from the analysts covering Qurate Retail here for free.
What Does the ROCE Trend For Qurate Retail Tell Us?
Qurate Retail has not disappointed in regards to ROCE growth. The figures show that over the last five years, returns on capital have grown by 142%. That's not bad because this tells for every dollar invested (capital employed), the company is increasing the amount earned from that dollar. Speaking of capital employed, the company is actually utilizing 33% less than it was five years ago, which can be indicative of a business that's improving its efficiency. Qurate Retail may be selling some assets so it's worth investigating if the business has plans for future investments to increase returns further still.
For the record though, there was a noticeable increase in the company's current liabilities over the period, so we would attribute some of the ROCE growth to that. The current liabilities has increased to 26% of total assets, so the business is now more funded by the likes of its suppliers or short-term creditors. Keep an eye out for future increases because when the ratio of current liabilities to total assets gets particularly high, this can introduce some new risks for the business.
The Bottom Line On Qurate Retail's ROCE
In the end, Qurate Retail has proven it's capital allocation skills are good with those higher returns from less amount of capital. And given the stock has remained rather flat over the last three years, there might be an opportunity here if other metrics are strong. So researching this company further and determining whether or not these trends will continue seems justified.
If you want to know some of the risks facing Qurate Retail we've found 3 warning signs (2 are a bit concerning!) that you should be aware of before investing here.
For those who like to invest in solid companies, check out this free list of companies with solid balance sheets and high returns on equity.
Have feedback on this article? Concerned about the content? Get in touch with us directly. Alternatively, email editorial-team (at) simplywallst.com.
This article by Simply Wall St is general in nature. We provide commentary based on historical data and analyst forecasts only using an unbiased methodology and our articles are not intended to be financial advice. It does not constitute a recommendation to buy or sell any stock, and does not take account of your objectives, or your financial situation. We aim to bring you long-term focused analysis driven by fundamental data. Note that our analysis may not factor in the latest price-sensitive company announcements or qualitative material. Simply Wall St has no position in any stocks mentioned.
