
 Yahoo Finance
 RADCOM (NASDAQ:RDCM) shareholder returns have been , earning 14% in 5 years
RADCOM Ltd. (NASDAQ:RDCM) shareholders have seen the share price descend 10% over the month. But at least the stock is up over the last five years. Unfortunately its return of 14% is below the market return of 96%.
The past week has proven to be lucrative for RADCOM investors, so let's see if fundamentals drove the company's five-year performance.
Check out our latest analysis for RADCOM
There is no denying that markets are sometimes efficient, but prices do not always reflect underlying business performance. One imperfect but simple way to consider how the market perception of a company has shifted is to compare the change in the earnings per share (EPS) with the share price movement.
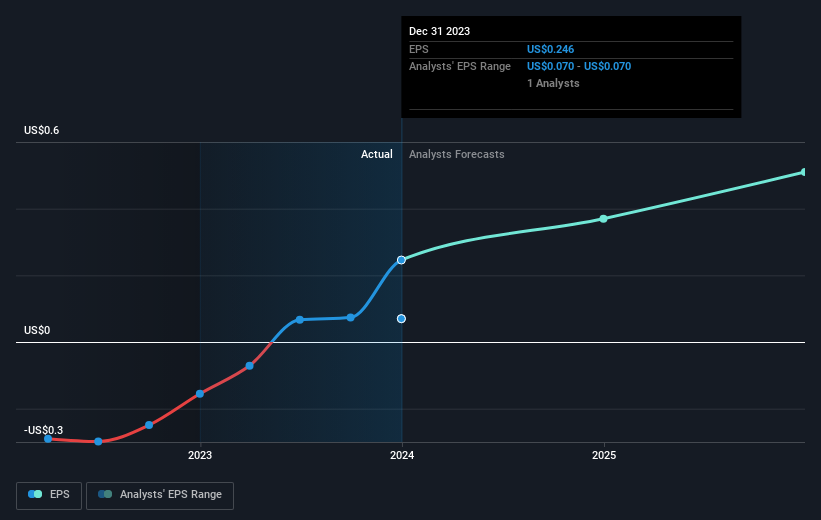
During the five years of share price growth, RADCOM moved from a loss to profitability. That's generally thought to be a genuine positive, so investors may expect to see an increasing share price.
The company's earnings per share (over time) is depicted in the image below (click to see the exact numbers).
It is of course excellent to see how RADCOM has grown profits over the years, but the future is more important for shareholders. If you are thinking of buying or selling RADCOM stock, you should check out this FREE detailed report on its balance sheet.
A Different Perspective
RADCOM shareholders gained a total return of 2.2% during the year. Unfortunately this falls short of the market return. On the bright side, the longer term returns (running at about 3% a year, over half a decade) look better. It's quite possible the business continues to execute with prowess, even as the share price gains are slowing. It's always interesting to track share price performance over the longer term. But to understand RADCOM better, we need to consider many other factors. Case in point: We've spotted 1 warning sign for RADCOM you should be aware of.
We will like RADCOM better if we see some big insider buys. While we wait, check out this free list of growing companies with considerable, recent, insider buying.
Please note, the market returns quoted in this article reflect the market weighted average returns of stocks that currently trade on American exchanges.
Have feedback on this article? Concerned about the content? Get in touch with us directly. Alternatively, email editorial-team (at) simplywallst.com.
This article by Simply Wall St is general in nature. We provide commentary based on historical data and analyst forecasts only using an unbiased methodology and our articles are not intended to be financial advice. It does not constitute a recommendation to buy or sell any stock, and does not take account of your objectives, or your financial situation. We aim to bring you long-term focused analysis driven by fundamental data. Note that our analysis may not factor in the latest price-sensitive company announcements or qualitative material. Simply Wall St has no position in any stocks mentioned.
