
 Yahoo Finance
 What Is Rank Group's (LON:RNK) P/E Ratio After Its Share Price Rocketed?

It's really great to see that even after a strong run, Rank Group (LON:RNK) shares have been powering on, with a gain of 32% in the last thirty days. Looking back a bit further, we're also happy to report the stock is up 57% in the last year.
Assuming no other changes, a sharply higher share price makes a stock less attractive to potential buyers. While the market sentiment towards a stock is very changeable, in the long run, the share price will tend to move in the same direction as earnings per share. So some would prefer to hold off buying when there is a lot of optimism towards a stock. One way to gauge market expectations of a stock is to look at its Price to Earnings Ratio (PE Ratio). Investors have optimistic expectations of companies with higher P/E ratios, compared to companies with lower P/E ratios.
Check out our latest analysis for Rank Group
How Does Rank Group's P/E Ratio Compare To Its Peers?
We can tell from its P/E ratio of 33.90 that there is some investor optimism about Rank Group. You can see in the image below that the average P/E (24.6) for companies in the hospitality industry is lower than Rank Group's P/E.
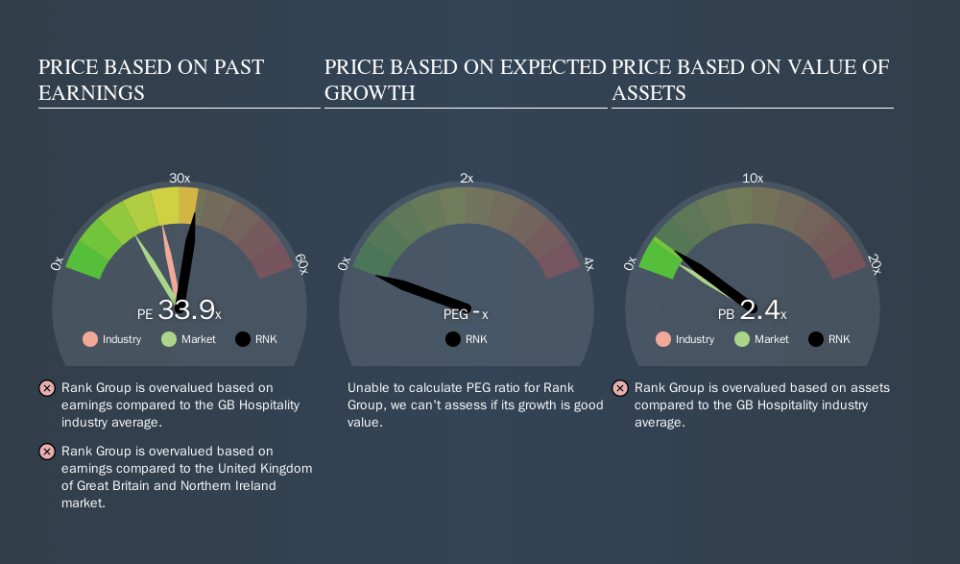
Rank Group's P/E tells us that market participants think the company will perform better than its industry peers, going forward. Clearly the market expects growth, but it isn't guaranteed. So investors should always consider the P/E ratio alongside other factors, such as whether company directors have been buying shares.
How Growth Rates Impact P/E Ratios
When earnings fall, the 'E' decreases, over time. That means unless the share price falls, the P/E will increase in a few years. So while a stock may look cheap based on past earnings, it could be expensive based on future earnings.
Rank Group shrunk earnings per share by 23% over the last year. But over the longer term (5 years) earnings per share have increased by 9.7%. And it has shrunk its earnings per share by 27% per year over the last three years. This could justify a low P/E.
Remember: P/E Ratios Don't Consider The Balance Sheet
It's important to note that the P/E ratio considers the market capitalization, not the enterprise value. That means it doesn't take debt or cash into account. In theory, a company can lower its future P/E ratio by using cash or debt to invest in growth.
Such expenditure might be good or bad, in the long term, but the point here is that the balance sheet is not reflected by this ratio.
How Does Rank Group's Debt Impact Its P/E Ratio?
The extra options and safety that comes with Rank Group's UK£8.7m net cash position means that it deserves a higher P/E than it would if it had a lot of net debt.
The Bottom Line On Rank Group's P/E Ratio
Rank Group has a P/E of 33.9. That's higher than the average in its market, which is 16.7. The recent drop in earnings per share would make some investors cautious, but the healthy balance sheet means the company retains potential for future growth. If fails to eventuate, the current high P/E could prove to be temporary, as the share price falls. What we know for sure is that investors have become much more excited about Rank Group recently, since they have pushed its P/E ratio from 25.7 to 33.9 over the last month. If you like to buy stocks that have recently impressed the market, then this one might be a candidate; but if you prefer to invest when there is 'blood in the streets', then you may feel the opportunity has passed.
Investors have an opportunity when market expectations about a stock are wrong. As value investor Benjamin Graham famously said, 'In the short run, the market is a voting machine but in the long run, it is a weighing machine. So this free visualization of the analyst consensus on future earnings could help you make the right decision about whether to buy, sell, or hold.
You might be able to find a better buy than Rank Group. If you want a selection of possible winners, check out this free list of interesting companies that trade on a P/E below 20 (but have proven they can grow earnings).
We aim to bring you long-term focused research analysis driven by fundamental data. Note that our analysis may not factor in the latest price-sensitive company announcements or qualitative material.
If you spot an error that warrants correction, please contact the editor at editorial-team@simplywallst.com. This article by Simply Wall St is general in nature. It does not constitute a recommendation to buy or sell any stock, and does not take account of your objectives, or your financial situation. Simply Wall St has no position in the stocks mentioned. Thank you for reading.
