
 Yahoo Finance
 Rathbones Group (LON:RAT) investors are sitting on a loss of 5.4% if they invested five years ago
The main aim of stock picking is to find the market-beating stocks. But in any portfolio, there will be mixed results between individual stocks. So we wouldn't blame long term Rathbones Group Plc (LON:RAT) shareholders for doubting their decision to hold, with the stock down 21% over a half decade.
Now let's have a look at the company's fundamentals, and see if the long term shareholder return has matched the performance of the underlying business.
Check out our latest analysis for Rathbones Group
There is no denying that markets are sometimes efficient, but prices do not always reflect underlying business performance. By comparing earnings per share (EPS) and share price changes over time, we can get a feel for how investor attitudes to a company have morphed over time.
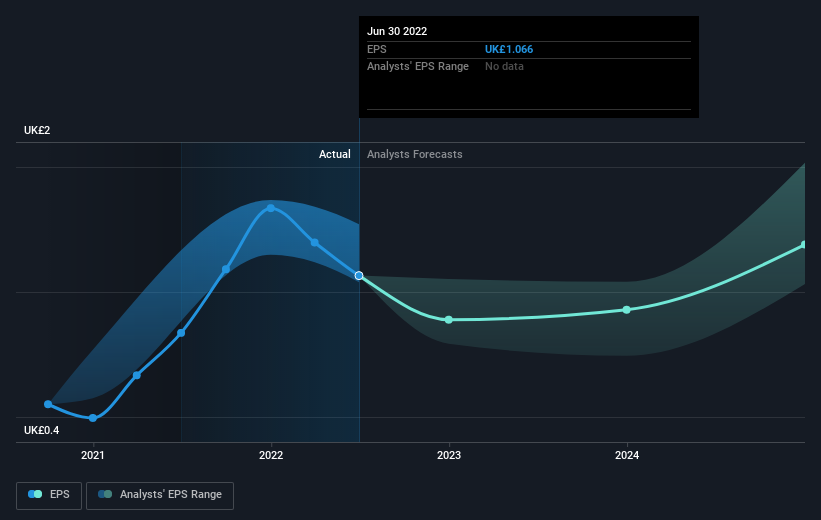
While the share price declined over five years, Rathbones Group actually managed to increase EPS by an average of 4.5% per year. Given the share price reaction, one might suspect that EPS is not a good guide to the business performance during the period (perhaps due to a one-off loss or gain). Alternatively, growth expectations may have been unreasonable in the past.
Given EPS is up and the share price is down, it's clear the market is more concerned about the business than it was previously. Having said that, if the EPS gains continue we'd expect the share price to improve, longer term.
You can see below how EPS has changed over time (discover the exact values by clicking on the image).
We know that Rathbones Group has improved its bottom line over the last three years, but what does the future have in store? If you are thinking of buying or selling Rathbones Group stock, you should check out this FREE detailed report on its balance sheet.
What About Dividends?
When looking at investment returns, it is important to consider the difference between total shareholder return (TSR) and share price return. The TSR incorporates the value of any spin-offs or discounted capital raisings, along with any dividends, based on the assumption that the dividends are reinvested. So for companies that pay a generous dividend, the TSR is often a lot higher than the share price return. In the case of Rathbones Group, it has a TSR of -5.4% for the last 5 years. That exceeds its share price return that we previously mentioned. This is largely a result of its dividend payments!
A Different Perspective
It's nice to see that Rathbones Group shareholders have received a total shareholder return of 11% over the last year. And that does include the dividend. Notably the five-year annualised TSR loss of 1.1% per year compares very unfavourably with the recent share price performance. The long term loss makes us cautious, but the short term TSR gain certainly hints at a brighter future. Before spending more time on Rathbones Group it might be wise to click here to see if insiders have been buying or selling shares.
If you like to buy stocks alongside management, then you might just love this free list of companies. (Hint: insiders have been buying them).
Please note, the market returns quoted in this article reflect the market weighted average returns of stocks that currently trade on GB exchanges.
Have feedback on this article? Concerned about the content? Get in touch with us directly. Alternatively, email editorial-team (at) simplywallst.com.
This article by Simply Wall St is general in nature. We provide commentary based on historical data and analyst forecasts only using an unbiased methodology and our articles are not intended to be financial advice. It does not constitute a recommendation to buy or sell any stock, and does not take account of your objectives, or your financial situation. We aim to bring you long-term focused analysis driven by fundamental data. Note that our analysis may not factor in the latest price-sensitive company announcements or qualitative material. Simply Wall St has no position in any stocks mentioned.
Join A Paid User Research Session
You’ll receive a US$30 Amazon Gift card for 1 hour of your time while helping us build better investing tools for the individual investors like yourself. Sign up here
