
 Yahoo Finance
 Rave Restaurant Group (NASDAQ:RAVE) Might Have The Makings Of A Multi-Bagger
What trends should we look for it we want to identify stocks that can multiply in value over the long term? Ideally, a business will show two trends; firstly a growing return on capital employed (ROCE) and secondly, an increasing amount of capital employed. This shows us that it's a compounding machine, able to continually reinvest its earnings back into the business and generate higher returns. Speaking of which, we noticed some great changes in Rave Restaurant Group's (NASDAQ:RAVE) returns on capital, so let's have a look.
Return On Capital Employed (ROCE): What Is It?
Just to clarify if you're unsure, ROCE is a metric for evaluating how much pre-tax income (in percentage terms) a company earns on the capital invested in its business. Analysts use this formula to calculate it for Rave Restaurant Group:
Return on Capital Employed = Earnings Before Interest and Tax (EBIT) ÷ (Total Assets - Current Liabilities)
0.19 = US$2.3m ÷ (US$14m - US$1.7m) (Based on the trailing twelve months to December 2023).
Thus, Rave Restaurant Group has an ROCE of 19%. On its own, that's a standard return, however it's much better than the 9.6% generated by the Hospitality industry.
Check out our latest analysis for Rave Restaurant Group
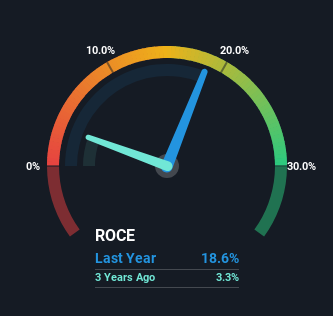
Historical performance is a great place to start when researching a stock so above you can see the gauge for Rave Restaurant Group's ROCE against it's prior returns. If you want to delve into the historical earnings , check out these free graphs detailing revenue and cash flow performance of Rave Restaurant Group.
What Can We Tell From Rave Restaurant Group's ROCE Trend?
We like the trends that we're seeing from Rave Restaurant Group. The data shows that returns on capital have increased substantially over the last five years to 19%. The amount of capital employed has increased too, by 32%. The increasing returns on a growing amount of capital is common amongst multi-baggers and that's why we're impressed.
Our Take On Rave Restaurant Group's ROCE
In summary, it's great to see that Rave Restaurant Group can compound returns by consistently reinvesting capital at increasing rates of return, because these are some of the key ingredients of those highly sought after multi-baggers. Since the stock has only returned 39% to shareholders over the last five years, the promising fundamentals may not be recognized yet by investors. So with that in mind, we think the stock deserves further research.
If you'd like to know about the risks facing Rave Restaurant Group, we've discovered 3 warning signs that you should be aware of.
While Rave Restaurant Group may not currently earn the highest returns, we've compiled a list of companies that currently earn more than 25% return on equity. Check out this free list here.
Have feedback on this article? Concerned about the content? Get in touch with us directly. Alternatively, email editorial-team (at) simplywallst.com.
This article by Simply Wall St is general in nature. We provide commentary based on historical data and analyst forecasts only using an unbiased methodology and our articles are not intended to be financial advice. It does not constitute a recommendation to buy or sell any stock, and does not take account of your objectives, or your financial situation. We aim to bring you long-term focused analysis driven by fundamental data. Note that our analysis may not factor in the latest price-sensitive company announcements or qualitative material. Simply Wall St has no position in any stocks mentioned.
