
 Yahoo Finance
 Read This Before You Buy Direct Line Insurance Group plc (LON:DLG) Because Of Its P/E Ratio

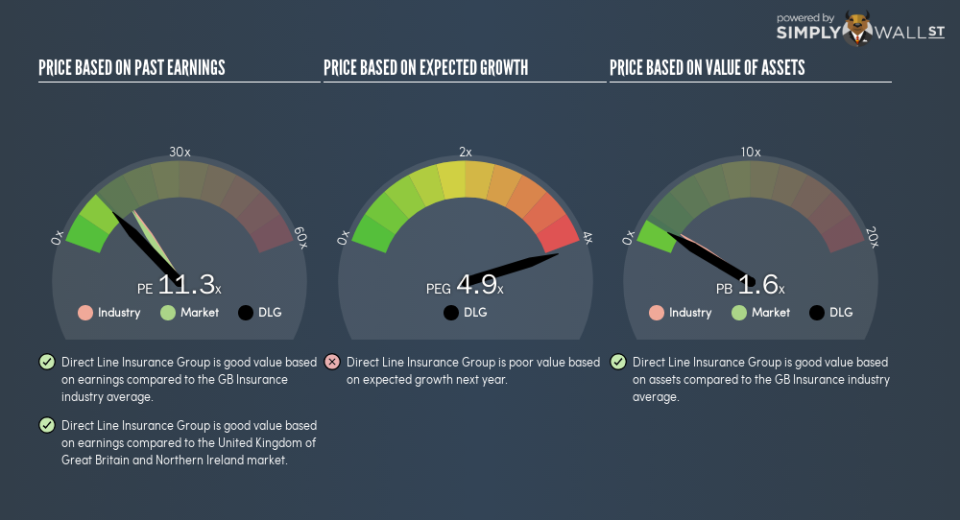
This article is for investors who would like to improve their understanding of price to earnings ratios (P/E ratios). We’ll show how you can use Direct Line Insurance Group plc’s (LON:DLG) P/E ratio to inform your assessment of the investment opportunity. Based on the last twelve months, Direct Line Insurance Group’s P/E ratio is 11.31. That corresponds to an earnings yield of approximately 8.8%.
See our latest analysis for Direct Line Insurance Group
Want to help shape the future of investing tools and platforms? Take the survey and be part of one of the most advanced studies of stock market investors to date.
How Do I Calculate A Price To Earnings Ratio?
The formula for price to earnings is:
Price to Earnings Ratio = Price per Share ÷ Earnings per Share (EPS)
Or for Direct Line Insurance Group:
P/E of 11.31 = £3.22 ÷ £0.28 (Based on the year to June 2018.)
Is A High Price-to-Earnings Ratio Good?
A higher P/E ratio means that investors are paying a higher price for each £1 of company earnings. That is not a good or a bad thing per se, but a high P/E does imply buyers are optimistic about the future.
How Growth Rates Impact P/E Ratios
P/E ratios primarily reflect market expectations around earnings growth rates. That’s because companies that grow earnings per share quickly will rapidly increase the ‘E’ in the equation. Therefore, even if you pay a high multiple of earnings now, that multiple will become lower in the future. So while a stock may look expensive based on past earnings, it could be cheap based on future earnings.
It’s great to see that Direct Line Insurance Group grew EPS by 22% in the last year. And it has bolstered its earnings per share by 4.8% per year over the last five years. With that performance, you might expect an above average P/E ratio.
How Does Direct Line Insurance Group’s P/E Ratio Compare To Its Peers?
The P/E ratio essentially measures market expectations of a company. If you look at the image below, you can see Direct Line Insurance Group has a lower P/E than the average (16.1) in the insurance industry classification.
Its relatively low P/E ratio indicates that Direct Line Insurance Group shareholders think it will struggle to do as well as other companies in its industry classification. While current expectations are low, the stock could be undervalued if the situation is better than the market assumes. It is arguably worth checking if insiders are buying shares, because that might imply they believe the stock is undervalued.
A Limitation: P/E Ratios Ignore Debt and Cash In The Bank
The ‘Price’ in P/E reflects the market capitalization of the company. That means it doesn’t take debt or cash into account. Theoretically, a business can improve its earnings (and produce a lower P/E in the future), by taking on debt (or spending its remaining cash).
Such expenditure might be good or bad, in the long term, but the point here is that the balance sheet is not reflected by this ratio.
Direct Line Insurance Group’s Balance Sheet
Direct Line Insurance Group has net cash of UK£676m. That should lead to a higher P/E than if it did have debt, because its strong balance sheets gives it more options.
The Verdict On Direct Line Insurance Group’s P/E Ratio
Direct Line Insurance Group has a P/E of 11.3. That’s below the average in the GB market, which is 15.6. It grew its EPS nicely over the last year, and the healthy balance sheet implies there is more potential for growth. One might conclude that the market is a bit pessimistic, given the low P/E ratio.
Investors should be looking to buy stocks that the market is wrong about. As value investor Benjamin Graham famously said, ‘In the short run, the market is a voting machine but in the long run, it is a weighing machine.’ So this free visual report on analyst forecasts could hold they key to an excellent investment decision.
You might be able to find a better buy than Direct Line Insurance Group. If you want a selection of possible winners, check out this free list of interesting companies that trade on a P/E below 20 (but have proven they can grow earnings).
To help readers see past the short term volatility of the financial market, we aim to bring you a long-term focused research analysis purely driven by fundamental data. Note that our analysis does not factor in the latest price-sensitive company announcements.
The author is an independent contributor and at the time of publication had no position in the stocks mentioned. For errors that warrant correction please contact the editor at editorial-team@simplywallst.com.
