
 Yahoo Finance
 Read This Before You Buy HMS Holdings Corp. (NASDAQ:HMSY) Because Of Its P/E Ratio

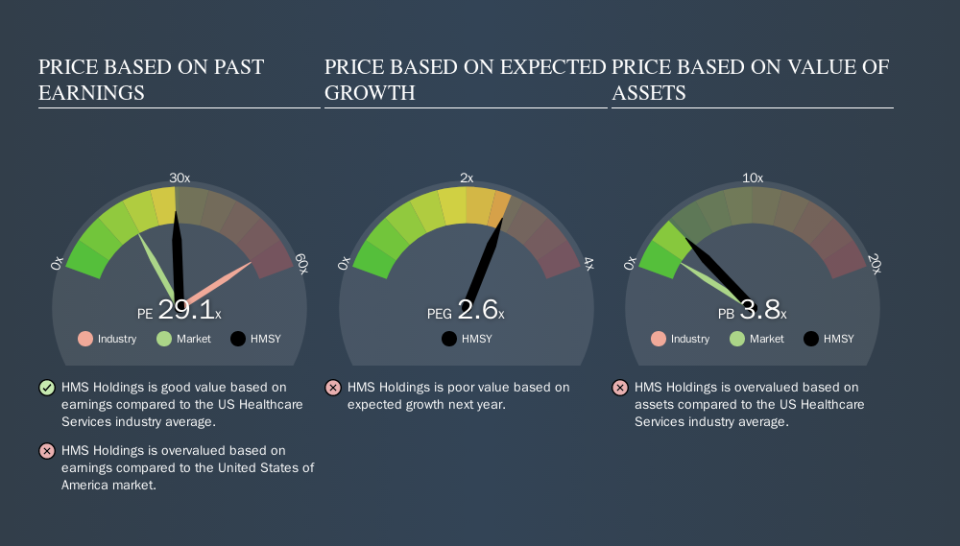
Today, we'll introduce the concept of the P/E ratio for those who are learning about investing. To keep it practical, we'll show how HMS Holdings Corp.'s (NASDAQ:HMSY) P/E ratio could help you assess the value on offer. Looking at earnings over the last twelve months, HMS Holdings has a P/E ratio of 29.06. That corresponds to an earnings yield of approximately 3.4%.
Check out our latest analysis for HMS Holdings
How Do I Calculate A Price To Earnings Ratio?
The formula for price to earnings is:
Price to Earnings Ratio = Share Price ÷ Earnings per Share (EPS)
Or for HMS Holdings:
P/E of 29.06 = $34.32 ÷ $1.18 (Based on the year to June 2019.)
Is A High P/E Ratio Good?
A higher P/E ratio implies that investors pay a higher price for the earning power of the business. That is not a good or a bad thing per se, but a high P/E does imply buyers are optimistic about the future.
How Does HMS Holdings's P/E Ratio Compare To Its Peers?
The P/E ratio essentially measures market expectations of a company. If you look at the image below, you can see HMS Holdings has a lower P/E than the average (54.6) in the healthcare services industry classification.
This suggests that market participants think HMS Holdings will underperform other companies in its industry. Since the market seems unimpressed with HMS Holdings, it's quite possible it could surprise on the upside. If you consider the stock interesting, further research is recommended. For example, I often monitor director buying and selling.
How Growth Rates Impact P/E Ratios
Earnings growth rates have a big influence on P/E ratios. That's because companies that grow earnings per share quickly will rapidly increase the 'E' in the equation. That means unless the share price increases, the P/E will reduce in a few years. And as that P/E ratio drops, the company will look cheap, unless its share price increases.
HMS Holdings's earnings made like a rocket, taking off 181% last year. The sweetener is that the annual five year growth rate of 26% is also impressive. So I'd be surprised if the P/E ratio was not above average.
A Limitation: P/E Ratios Ignore Debt and Cash In The Bank
The 'Price' in P/E reflects the market capitalization of the company. In other words, it does not consider any debt or cash that the company may have on the balance sheet. Theoretically, a business can improve its earnings (and produce a lower P/E in the future) by investing in growth. That means taking on debt (or spending its cash).
Spending on growth might be good or bad a few years later, but the point is that the P/E ratio does not account for the option (or lack thereof).
So What Does HMS Holdings's Balance Sheet Tell Us?
Since HMS Holdings holds net cash of US$29m, it can spend on growth, justifying a higher P/E ratio than otherwise.
The Verdict On HMS Holdings's P/E Ratio
HMS Holdings has a P/E of 29.1. That's higher than the average in its market, which is 17.6. The excess cash it carries is the gravy on top its fast EPS growth. So based on this analysis we'd expect HMS Holdings to have a high P/E ratio.
Investors should be looking to buy stocks that the market is wrong about. People often underestimate remarkable growth -- so investors can make money when fast growth is not fully appreciated. So this free report on the analyst consensus forecasts could help you make a master move on this stock.
Of course you might be able to find a better stock than HMS Holdings. So you may wish to see this free collection of other companies that have grown earnings strongly.
We aim to bring you long-term focused research analysis driven by fundamental data. Note that our analysis may not factor in the latest price-sensitive company announcements or qualitative material.
If you spot an error that warrants correction, please contact the editor at editorial-team@simplywallst.com. This article by Simply Wall St is general in nature. It does not constitute a recommendation to buy or sell any stock, and does not take account of your objectives, or your financial situation. Simply Wall St has no position in the stocks mentioned. Thank you for reading.
