
 Yahoo Finance
 Read This Before You Buy Nokian Renkaat Oyj (HEL:TYRES) Because Of Its P/E Ratio

This article is written for those who want to get better at using price to earnings ratios (P/E ratios). To keep it practical, we'll show how Nokian Renkaat Oyj's (HEL:TYRES) P/E ratio could help you assess the value on offer. What is Nokian Renkaat Oyj's P/E ratio? Well, based on the last twelve months it is 8.11. That corresponds to an earnings yield of approximately 12.3%.
See our latest analysis for Nokian Renkaat Oyj
How Do I Calculate A Price To Earnings Ratio?
The formula for P/E is:
Price to Earnings Ratio = Price per Share ÷ Earnings per Share (EPS)
Or for Nokian Renkaat Oyj:
P/E of 8.11 = €25.31 ÷ €3.12 (Based on the year to June 2019.)
Is A High P/E Ratio Good?
A higher P/E ratio means that buyers have to pay a higher price for each €1 the company has earned over the last year. That isn't necessarily good or bad, but a high P/E implies relatively high expectations of what a company can achieve in the future.
Does Nokian Renkaat Oyj Have A Relatively High Or Low P/E For Its Industry?
One good way to get a quick read on what market participants expect of a company is to look at its P/E ratio. We can see in the image below that the average P/E (11.0) for companies in the auto components industry is higher than Nokian Renkaat Oyj's P/E.
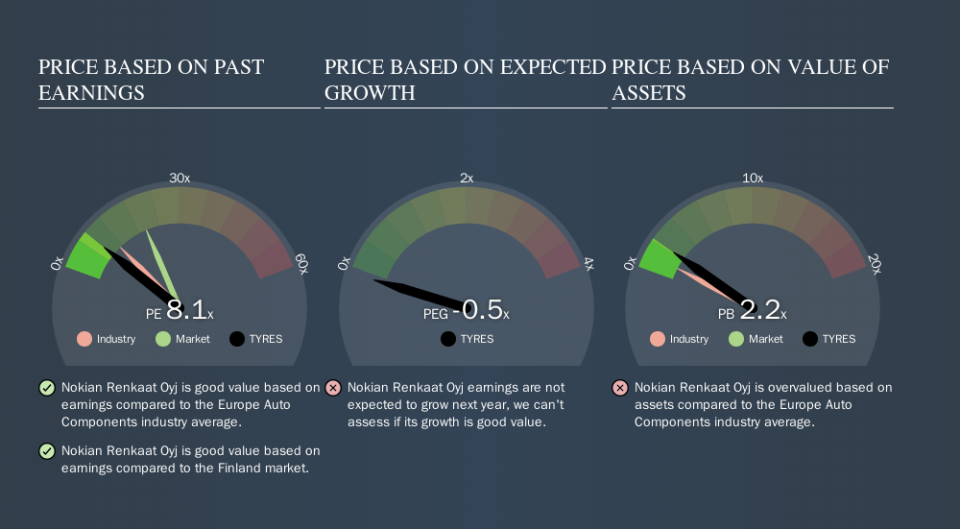
This suggests that market participants think Nokian Renkaat Oyj will underperform other companies in its industry. Since the market seems unimpressed with Nokian Renkaat Oyj, it's quite possible it could surprise on the upside. It is arguably worth checking if insiders are buying shares, because that might imply they believe the stock is undervalued.
How Growth Rates Impact P/E Ratios
Probably the most important factor in determining what P/E a company trades on is the earnings growth. Earnings growth means that in the future the 'E' will be higher. Therefore, even if you pay a high multiple of earnings now, that multiple will become lower in the future. And as that P/E ratio drops, the company will look cheap, unless its share price increases.
In the last year, Nokian Renkaat Oyj grew EPS like Taylor Swift grew her fan base back in 2010; the 79% gain was both fast and well deserved. The cherry on top is that the five year growth rate was an impressive 24% per year. So I'd be surprised if the P/E ratio was not above average.
A Limitation: P/E Ratios Ignore Debt and Cash In The Bank
One drawback of using a P/E ratio is that it considers market capitalization, but not the balance sheet. So it won't reflect the advantage of cash, or disadvantage of debt. Hypothetically, a company could reduce its future P/E ratio by spending its cash (or taking on debt) to achieve higher earnings.
Such expenditure might be good or bad, in the long term, but the point here is that the balance sheet is not reflected by this ratio.
Is Debt Impacting Nokian Renkaat Oyj's P/E?
Nokian Renkaat Oyj has net debt worth just 3.6% of its market capitalization. The market might award it a higher P/E ratio if it had net cash, but its unlikely this low level of net borrowing is having a big impact on the P/E multiple.
The Verdict On Nokian Renkaat Oyj's P/E Ratio
Nokian Renkaat Oyj's P/E is 8.1 which is below average (20.3) in the FI market. The company hasn't stretched its balance sheet, and earnings growth was good last year. The low P/E ratio suggests current market expectations are muted, implying these levels of growth will not continue.
Investors should be looking to buy stocks that the market is wrong about. As value investor Benjamin Graham famously said, 'In the short run, the market is a voting machine but in the long run, it is a weighing machine. So this free report on the analyst consensus forecasts could help you make a master move on this stock.
Of course, you might find a fantastic investment by looking at a few good candidates. So take a peek at this free list of companies with modest (or no) debt, trading on a P/E below 20.
We aim to bring you long-term focused research analysis driven by fundamental data. Note that our analysis may not factor in the latest price-sensitive company announcements or qualitative material.
If you spot an error that warrants correction, please contact the editor at editorial-team@simplywallst.com. This article by Simply Wall St is general in nature. It does not constitute a recommendation to buy or sell any stock, and does not take account of your objectives, or your financial situation. Simply Wall St has no position in the stocks mentioned. Thank you for reading.
