
 Yahoo Finance
 Read This Before You Buy nVent Electric plc (NYSE:NVT) Because Of Its P/E Ratio

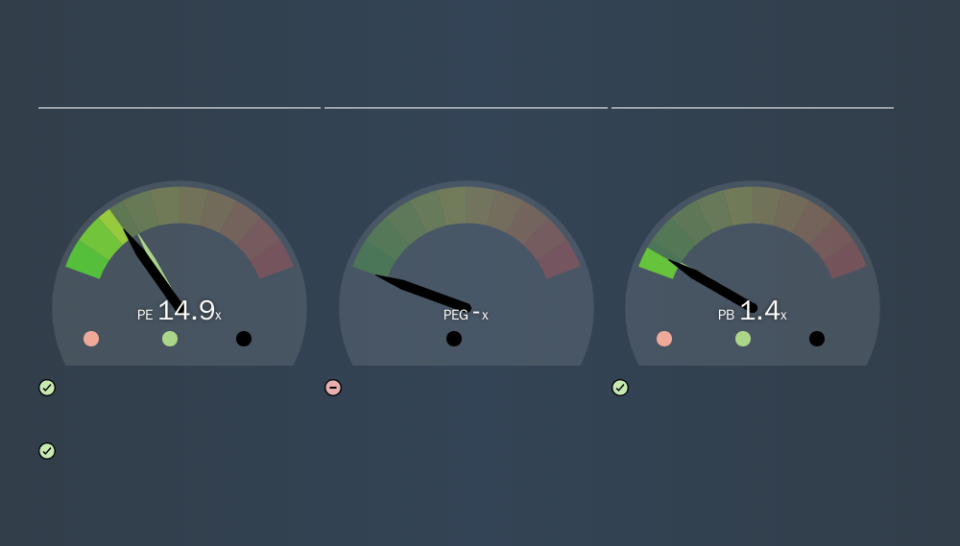
The goal of this article is to teach you how to use price to earnings ratios (P/E ratios). To keep it practical, we'll show how nVent Electric plc's (NYSE:NVT) P/E ratio could help you assess the value on offer. nVent Electric has a price to earnings ratio of 14.87, based on the last twelve months. That means that at current prices, buyers pay $14.87 for every $1 in trailing yearly profits.
Check out our latest analysis for nVent Electric
How Do You Calculate A P/E Ratio?
The formula for price to earnings is:
Price to Earnings Ratio = Price per Share ÷ Earnings per Share (EPS)
Or for nVent Electric:
P/E of 14.87 = $21.3 ÷ $1.43 (Based on the trailing twelve months to June 2019.)
Is A High Price-to-Earnings Ratio Good?
A higher P/E ratio means that investors are paying a higher price for each $1 of company earnings. All else being equal, it's better to pay a low price -- but as Warren Buffett said, 'It's far better to buy a wonderful company at a fair price than a fair company at a wonderful price.'
Does nVent Electric Have A Relatively High Or Low P/E For Its Industry?
The P/E ratio indicates whether the market has higher or lower expectations of a company. As you can see below nVent Electric has a P/E ratio that is fairly close for the average for the electrical industry, which is 15.3.
That indicates that the market expects nVent Electric will perform roughly in line with other companies in its industry. If the company has better than average prospects, then the market might be underestimating it. Further research into factors such as insider buying and selling, could help you form your own view on whether that is likely.
How Growth Rates Impact P/E Ratios
Earnings growth rates have a big influence on P/E ratios. If earnings are growing quickly, then the 'E' in the equation will increase faster than it would otherwise. And in that case, the P/E ratio itself will drop rather quickly. Then, a lower P/E should attract more buyers, pushing the share price up.
nVent Electric shrunk earnings per share by 23% over the last year.
A Limitation: P/E Ratios Ignore Debt and Cash In The Bank
One drawback of using a P/E ratio is that it considers market capitalization, but not the balance sheet. So it won't reflect the advantage of cash, or disadvantage of debt. In theory, a company can lower its future P/E ratio by using cash or debt to invest in growth.
Spending on growth might be good or bad a few years later, but the point is that the P/E ratio does not account for the option (or lack thereof).
How Does nVent Electric's Debt Impact Its P/E Ratio?
nVent Electric's net debt equates to 29% of its market capitalization. You'd want to be aware of this fact, but it doesn't bother us.
The Bottom Line On nVent Electric's P/E Ratio
nVent Electric trades on a P/E ratio of 14.9, which is below the US market average of 17.5. The debt levels are not a major concern, but the lack of EPS growth is likely weighing on sentiment.
When the market is wrong about a stock, it gives savvy investors an opportunity. If it is underestimating a company, investors can make money by buying and holding the shares until the market corrects itself. So this free visual report on analyst forecasts could hold the key to an excellent investment decision.
Of course, you might find a fantastic investment by looking at a few good candidates. So take a peek at this free list of companies with modest (or no) debt, trading on a P/E below 20.
We aim to bring you long-term focused research analysis driven by fundamental data. Note that our analysis may not factor in the latest price-sensitive company announcements or qualitative material.
If you spot an error that warrants correction, please contact the editor at editorial-team@simplywallst.com. This article by Simply Wall St is general in nature. It does not constitute a recommendation to buy or sell any stock, and does not take account of your objectives, or your financial situation. Simply Wall St has no position in the stocks mentioned. Thank you for reading.
