
 Yahoo Finance
 Read This Before You Buy PageGroup plc (LON:PAGE) Because Of Its P/E Ratio

Want to participate in a short research study? Help shape the future of investing tools and you could win a $250 gift card!
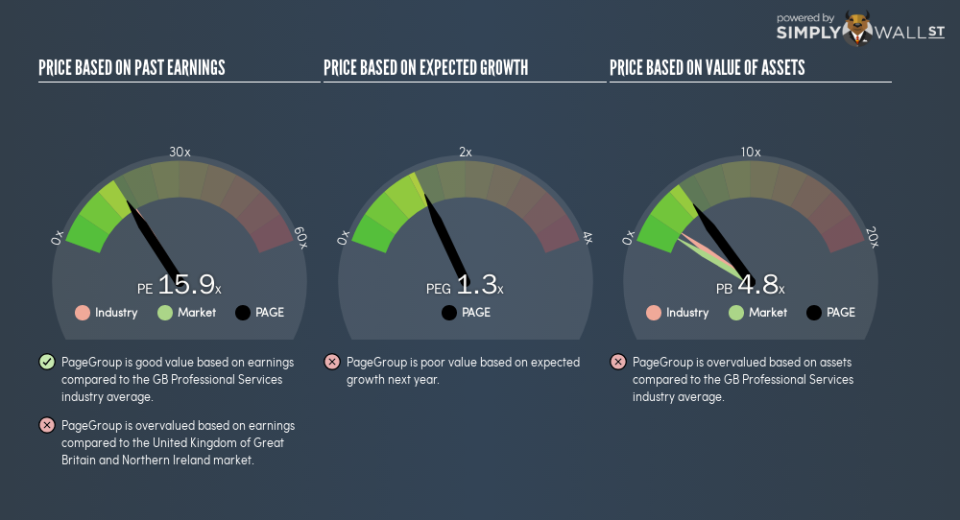
This article is for investors who would like to improve their understanding of price to earnings ratios (P/E ratios). We’ll look at PageGroup plc’s (LON:PAGE) P/E ratio and reflect on what it tells us about the company’s share price. PageGroup has a P/E ratio of 15.9, based on the last twelve months. That is equivalent to an earnings yield of about 6.3%.
Check out our latest analysis for PageGroup
How Do You Calculate A P/E Ratio?
The formula for price to earnings is:
Price to Earnings Ratio = Price per Share ÷ Earnings per Share (EPS)
Or for PageGroup:
P/E of 15.9 = £4.6 ÷ £0.29 (Based on the year to June 2018.)
Is A High P/E Ratio Good?
A higher P/E ratio implies that investors pay a higher price for the earning power of the business. All else being equal, it’s better to pay a low price — but as Warren Buffett said, ‘It’s far better to buy a wonderful company at a fair price than a fair company at a wonderful price.’
How Growth Rates Impact P/E Ratios
Earnings growth rates have a big influence on P/E ratios. That’s because companies that grow earnings per share quickly will rapidly increase the ‘E’ in the equation. Therefore, even if you pay a high multiple of earnings now, that multiple will become lower in the future. Then, a lower P/E should attract more buyers, pushing the share price up.
Most would be impressed by PageGroup earnings growth of 14% in the last year. And earnings per share have improved by 15% annually, over the last five years. So one might expect an above average P/E ratio.
How Does PageGroup’s P/E Ratio Compare To Its Peers?
We can get an indication of market expectations by looking at the P/E ratio. You can see in the image below that the average P/E (17) for companies in the professional services industry is roughly the same as PageGroup’s P/E.
Its P/E ratio suggests that PageGroup shareholders think that in the future it will perform about the same as other companies in its industry classification. The company could surprise by performing better than average, in the future. Further research into factors such asmanagement tenure, could help you form your own view on whether that is likely.
A Limitation: P/E Ratios Ignore Debt and Cash In The Bank
Don’t forget that the P/E ratio considers market capitalization. Thus, the metric does not reflect cash or debt held by the company. In theory, a company can lower its future P/E ratio by using cash or debt to invest in growth.
Spending on growth might be good or bad a few years later, but the point is that the P/E ratio does not account for the option (or lack thereof).
How Does PageGroup’s Debt Impact Its P/E Ratio?
PageGroup has net cash of UK£87m. That should lead to a higher P/E than if it did have debt, because its strong balance sheets gives it more options.
The Bottom Line On PageGroup’s P/E Ratio
PageGroup has a P/E of 15.9. That’s around the same as the average in the GB market, which is 15.7. The balance sheet is healthy, and recent EPS growth impressive, but the P/E implies some caution from the market. Since analysts are predicting growth will continue, one might expect to see a higher P/E so it may be worth looking closer.
When the market is wrong about a stock, it gives savvy investors an opportunity. As value investor Benjamin Graham famously said, ‘In the short run, the market is a voting machine but in the long run, it is a weighing machine.’ So this free visual report on analyst forecasts could hold they key to an excellent investment decision.
Of course you might be able to find a better stock than PageGroup. So you may wish to see this free collection of other companies that have grown earnings strongly.
To help readers see past the short term volatility of the financial market, we aim to bring you a long-term focused research analysis purely driven by fundamental data. Note that our analysis does not factor in the latest price-sensitive company announcements.
The author is an independent contributor and at the time of publication had no position in the stocks mentioned. For errors that warrant correction please contact the editor at editorial-team@simplywallst.com.
