
 Yahoo Finance
 Read This Before Buying Italgas S.p.A. (BIT:IG) For Its Dividend

Is Italgas S.p.A. (BIT:IG) a good dividend stock? How can we tell? Dividend paying companies with growing earnings can be highly rewarding in the long term. Yet sometimes, investors buy a popular dividend stock because of its yield, and then lose money if the company's dividend doesn't live up to expectations.
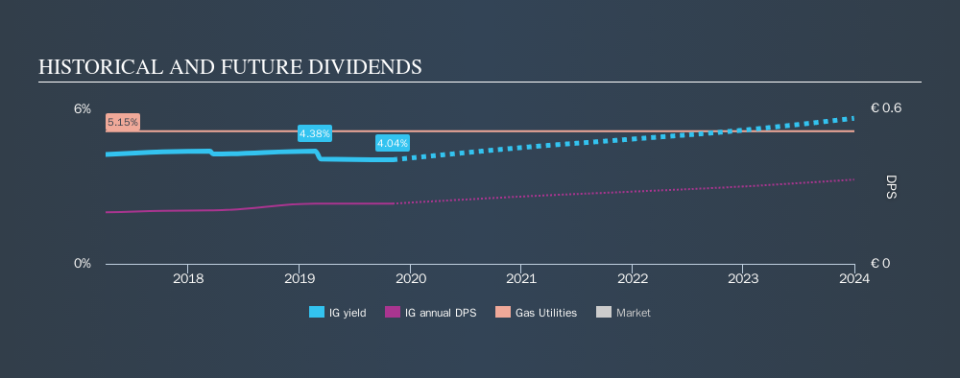
In this case, Italgas pays a decent-sized 4.0% dividend yield, and has been distributing cash to shareholders for the past three years. A high yield probably looks enticing, but investors are likely wondering about the short payment history. Some simple analysis can offer a lot of insights when buying a company for its dividend, and we'll go through this below.
Explore this interactive chart for our latest analysis on Italgas!
Payout ratios
Dividends are typically paid from company earnings. If a company pays more in dividends than it earned, then the dividend might become unsustainable - hardly an ideal situation. So we need to form a view on if a company's dividend is sustainable, relative to its net profit after tax. Looking at the data, we can see that 57% of Italgas's profits were paid out as dividends in the last 12 months. This is a fairly normal payout ratio among most businesses. It allows a higher dividend to be paid to shareholders, but does limit the capital retained in the business - which could be good or bad.
In addition to comparing dividends against profits, we should inspect whether the company generated enough cash to pay its dividend. With a cash payout ratio of 273%, Italgas's dividend payments are poorly covered by cash flow. Paying out more than 100% of your free cash flow in dividends is generally not a long-term, sustainable state of affairs, so we think shareholders should watch this metric closely. Italgas paid out less in dividends than it reported in profits, but unfortunately it didn't generate enough free cash flow to cover the dividend. Were it to repeatedly pay dividends that were not well covered by cash flow, this could be a risk to Italgas's ability to maintain its dividend.
Is Italgas's Balance Sheet Risky?
As Italgas has a meaningful amount of debt, we need to check its balance sheet to see if the company might have debt risks. A quick check of its financial situation can be done with two ratios: net debt divided by EBITDA (earnings before interest, tax, depreciation and amortisation), and net interest cover. Net debt to EBITDA measures total debt load relative to company earnings (lower = less debt), while net interest cover measures the ability to pay interest on the debt (higher = greater ability to pay interest costs). With net debt of 4.25 times its EBITDA, investors are starting to take on a meaningful amount of risk, should the business enter a downturn.
We calculated its interest cover by measuring its earnings before interest and tax (EBIT), and dividing this by the company's net interest expense. Italgas has interest cover of more than 12 times its interest expense, which we think is quite strong.
Remember, you can always get a snapshot of Italgas's latest financial position, by checking our visualisation of its financial health.
Dividend Volatility
Before buying a stock for its income, we want to see if the dividends have been stable in the past, and if the company has a track record of maintaining its dividend. The dividend has not fluctuated much, but with a relatively short payment history, we can't be sure this is sustainable across a full market cycle. During the past three-year period, the first annual payment was €0.20 in 2016, compared to €0.23 last year. Dividends per share have grown at approximately 5.4% per year over this time.
Italgas has been growing its dividend at a decent rate, and the payments have been stable despite the short payment history. This is a positive start.
Dividend Growth Potential
While dividend payments have been relatively reliable, it would also be nice if earnings per share (EPS) were growing, as this is essential to maintaining the dividend's purchasing power over the long term. Italgas's EPS have fallen by approximately 19% per year. A sharp decline in earnings per share is not great from from a dividend perspective, as even conservative payout ratios can come under pressure if earnings fall far enough.
Conclusion
To summarise, shareholders should always check that Italgas's dividends are affordable, that its dividend payments are relatively stable, and that it has decent prospects for growing its earnings and dividend. First, the company has a payout ratio that was within an average range for most dividend stocks, but it paid out virtually all of its generated cash flow. Second, earnings per share have been in decline, and the dividend history is shorter than we'd like. There are a few too many issues for us to get comfortable with Italgas from a dividend perspective. Businesses can change, but we would struggle to identify why an investor should rely on this stock for their income.
Given that earnings are not growing, the dividend does not look nearly so attractive. Very few businesses see earnings consistently shrink year after year in perpetuity though, and so it might be worth seeing what the 15 analysts we track are forecasting for the future.
Looking for more high-yielding dividend ideas? Try our curated list of dividend stocks with a yield above 3%.
We aim to bring you long-term focused research analysis driven by fundamental data. Note that our analysis may not factor in the latest price-sensitive company announcements or qualitative material.
If you spot an error that warrants correction, please contact the editor at editorial-team@simplywallst.com. This article by Simply Wall St is general in nature. It does not constitute a recommendation to buy or sell any stock, and does not take account of your objectives, or your financial situation. Simply Wall St has no position in the stocks mentioned. Thank you for reading.
