
 Yahoo Finance
 There Are Reasons To Feel Uneasy About Angling Direct's (LON:ANG) Returns On Capital
If you're not sure where to start when looking for the next multi-bagger, there are a few key trends you should keep an eye out for. In a perfect world, we'd like to see a company investing more capital into its business and ideally the returns earned from that capital are also increasing. This shows us that it's a compounding machine, able to continually reinvest its earnings back into the business and generate higher returns. Although, when we looked at Angling Direct (LON:ANG), it didn't seem to tick all of these boxes.
Understanding Return On Capital Employed (ROCE)
For those that aren't sure what ROCE is, it measures the amount of pre-tax profits a company can generate from the capital employed in its business. The formula for this calculation on Angling Direct is:
Return on Capital Employed = Earnings Before Interest and Tax (EBIT) ÷ (Total Assets - Current Liabilities)
0.029 = UK£1.4m ÷ (UK£64m - UK£14m) (Based on the trailing twelve months to July 2023).
So, Angling Direct has an ROCE of 2.9%. Ultimately, that's a low return and it under-performs the Specialty Retail industry average of 14%.
Check out our latest analysis for Angling Direct
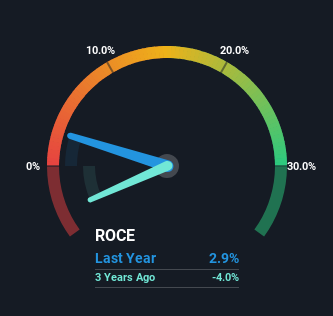
Above you can see how the current ROCE for Angling Direct compares to its prior returns on capital, but there's only so much you can tell from the past. If you're interested, you can view the analysts predictions in our free analyst report for Angling Direct .
What Can We Tell From Angling Direct's ROCE Trend?
On the surface, the trend of ROCE at Angling Direct doesn't inspire confidence. To be more specific, ROCE has fallen from 7.8% over the last five years. However it looks like Angling Direct might be reinvesting for long term growth because while capital employed has increased, the company's sales haven't changed much in the last 12 months. It may take some time before the company starts to see any change in earnings from these investments.
On a side note, Angling Direct has done well to pay down its current liabilities to 22% of total assets. So we could link some of this to the decrease in ROCE. Effectively this means their suppliers or short-term creditors are funding less of the business, which reduces some elements of risk. Since the business is basically funding more of its operations with it's own money, you could argue this has made the business less efficient at generating ROCE.
The Key Takeaway
In summary, Angling Direct is reinvesting funds back into the business for growth but unfortunately it looks like sales haven't increased much just yet. Since the stock has declined 47% over the last five years, investors may not be too optimistic on this trend improving either. All in all, the inherent trends aren't typical of multi-baggers, so if that's what you're after, we think you might have more luck elsewhere.
One more thing, we've spotted 1 warning sign facing Angling Direct that you might find interesting.
While Angling Direct isn't earning the highest return, check out this free list of companies that are earning high returns on equity with solid balance sheets.
Have feedback on this article? Concerned about the content? Get in touch with us directly. Alternatively, email editorial-team (at) simplywallst.com.
This article by Simply Wall St is general in nature. We provide commentary based on historical data and analyst forecasts only using an unbiased methodology and our articles are not intended to be financial advice. It does not constitute a recommendation to buy or sell any stock, and does not take account of your objectives, or your financial situation. We aim to bring you long-term focused analysis driven by fundamental data. Note that our analysis may not factor in the latest price-sensitive company announcements or qualitative material. Simply Wall St has no position in any stocks mentioned.
