
 Yahoo Finance
 There Are Reasons To Feel Uneasy About Bright Horizons Family Solutions' (NYSE:BFAM) Returns On Capital
What are the early trends we should look for to identify a stock that could multiply in value over the long term? Amongst other things, we'll want to see two things; firstly, a growing return on capital employed (ROCE) and secondly, an expansion in the company's amount of capital employed. Ultimately, this demonstrates that it's a business that is reinvesting profits at increasing rates of return. However, after briefly looking over the numbers, we don't think Bright Horizons Family Solutions (NYSE:BFAM) has the makings of a multi-bagger going forward, but let's have a look at why that may be.
What is Return On Capital Employed (ROCE)?
If you haven't worked with ROCE before, it measures the 'return' (pre-tax profit) a company generates from capital employed in its business. To calculate this metric for Bright Horizons Family Solutions, this is the formula:
Return on Capital Employed = Earnings Before Interest and Tax (EBIT) ÷ (Total Assets - Current Liabilities)
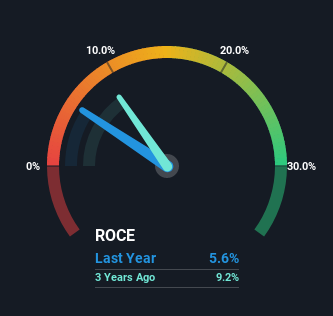
0.056 = US$166m ÷ (US$3.6b - US$599m) (Based on the trailing twelve months to March 2022).
So, Bright Horizons Family Solutions has an ROCE of 5.6%. On its own that's a low return on capital but it's in line with the industry's average returns of 6.3%.
Check out our latest analysis for Bright Horizons Family Solutions
In the above chart we have measured Bright Horizons Family Solutions' prior ROCE against its prior performance, but the future is arguably more important. If you'd like, you can check out the forecasts from the analysts covering Bright Horizons Family Solutions here for free.
What Does the ROCE Trend For Bright Horizons Family Solutions Tell Us?
In terms of Bright Horizons Family Solutions' historical ROCE movements, the trend isn't fantastic. To be more specific, ROCE has fallen from 10.0% over the last five years. Although, given both revenue and the amount of assets employed in the business have increased, it could suggest the company is investing in growth, and the extra capital has led to a short-term reduction in ROCE. And if the increased capital generates additional returns, the business, and thus shareholders, will benefit in the long run.
In Conclusion...
While returns have fallen for Bright Horizons Family Solutions in recent times, we're encouraged to see that sales are growing and that the business is reinvesting in its operations. These trends are starting to be recognized by investors since the stock has delivered a 8.8% gain to shareholders who've held over the last five years. Therefore we'd recommend looking further into this stock to confirm if it has the makings of a good investment.
On a final note, we've found 2 warning signs for Bright Horizons Family Solutions that we think you should be aware of.
For those who like to invest in solid companies, check out this free list of companies with solid balance sheets and high returns on equity.
Have feedback on this article? Concerned about the content? Get in touch with us directly. Alternatively, email editorial-team (at) simplywallst.com.
This article by Simply Wall St is general in nature. We provide commentary based on historical data and analyst forecasts only using an unbiased methodology and our articles are not intended to be financial advice. It does not constitute a recommendation to buy or sell any stock, and does not take account of your objectives, or your financial situation. We aim to bring you long-term focused analysis driven by fundamental data. Note that our analysis may not factor in the latest price-sensitive company announcements or qualitative material. Simply Wall St has no position in any stocks mentioned.
