
 Yahoo Finance
 There Are Reasons To Feel Uneasy About Bright Horizons Family Solutions' (NYSE:BFAM) Returns On Capital
Did you know there are some financial metrics that can provide clues of a potential multi-bagger? Typically, we'll want to notice a trend of growing return on capital employed (ROCE) and alongside that, an expanding base of capital employed. Ultimately, this demonstrates that it's a business that is reinvesting profits at increasing rates of return. Having said that, from a first glance at Bright Horizons Family Solutions (NYSE:BFAM) we aren't jumping out of our chairs at how returns are trending, but let's have a deeper look.
Understanding Return On Capital Employed (ROCE)
For those who don't know, ROCE is a measure of a company's yearly pre-tax profit (its return), relative to the capital employed in the business. To calculate this metric for Bright Horizons Family Solutions, this is the formula:
Return on Capital Employed = Earnings Before Interest and Tax (EBIT) ÷ (Total Assets - Current Liabilities)
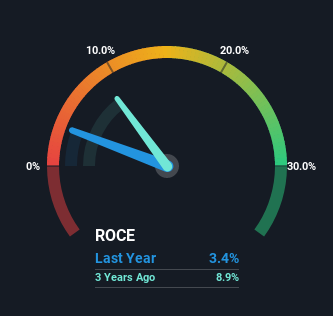
0.034 = US$104m ÷ (US$3.8b - US$788m) (Based on the trailing twelve months to March 2023).
Thus, Bright Horizons Family Solutions has an ROCE of 3.4%. In absolute terms, that's a low return and it also under-performs the Consumer Services industry average of 7.0%.
View our latest analysis for Bright Horizons Family Solutions
In the above chart we have measured Bright Horizons Family Solutions' prior ROCE against its prior performance, but the future is arguably more important. If you're interested, you can view the analysts predictions in our free report on analyst forecasts for the company.
The Trend Of ROCE
When we looked at the ROCE trend at Bright Horizons Family Solutions, we didn't gain much confidence. To be more specific, ROCE has fallen from 11% over the last five years. However, given capital employed and revenue have both increased it appears that the business is currently pursuing growth, at the consequence of short term returns. If these investments prove successful, this can bode very well for long term stock performance.
The Bottom Line On Bright Horizons Family Solutions' ROCE
Even though returns on capital have fallen in the short term, we find it promising that revenue and capital employed have both increased for Bright Horizons Family Solutions. And there could be an opportunity here if other metrics look good too, because the stock has declined 13% in the last five years. As a result, we'd recommend researching this stock further to uncover what other fundamentals of the business can show us.
Bright Horizons Family Solutions does come with some risks though, we found 3 warning signs in our investment analysis, and 1 of those is potentially serious...
While Bright Horizons Family Solutions isn't earning the highest return, check out this free list of companies that are earning high returns on equity with solid balance sheets.
Have feedback on this article? Concerned about the content? Get in touch with us directly. Alternatively, email editorial-team (at) simplywallst.com.
This article by Simply Wall St is general in nature. We provide commentary based on historical data and analyst forecasts only using an unbiased methodology and our articles are not intended to be financial advice. It does not constitute a recommendation to buy or sell any stock, and does not take account of your objectives, or your financial situation. We aim to bring you long-term focused analysis driven by fundamental data. Note that our analysis may not factor in the latest price-sensitive company announcements or qualitative material. Simply Wall St has no position in any stocks mentioned.
Join A Paid User Research Session
You’ll receive a US$30 Amazon Gift card for 1 hour of your time while helping us build better investing tools for the individual investors like yourself. Sign up here
