
 Yahoo Finance
 There Are Reasons To Feel Uneasy About Ceragon Networks' (NASDAQ:CRNT) Returns On Capital
If we want to find a stock that could multiply over the long term, what are the underlying trends we should look for? Firstly, we'd want to identify a growing return on capital employed (ROCE) and then alongside that, an ever-increasing base of capital employed. Ultimately, this demonstrates that it's a business that is reinvesting profits at increasing rates of return. Having said that, from a first glance at Ceragon Networks (NASDAQ:CRNT) we aren't jumping out of our chairs at how returns are trending, but let's have a deeper look.
Understanding Return On Capital Employed (ROCE)
For those who don't know, ROCE is a measure of a company's yearly pre-tax profit (its return), relative to the capital employed in the business. To calculate this metric for Ceragon Networks, this is the formula:
Return on Capital Employed = Earnings Before Interest and Tax (EBIT) ÷ (Total Assets - Current Liabilities)
0.017 = US$2.9m ÷ (US$300m - US$126m) (Based on the trailing twelve months to March 2022).
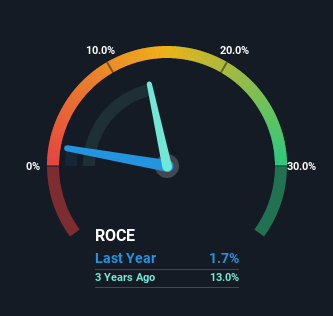
Thus, Ceragon Networks has an ROCE of 1.7%. In absolute terms, that's a low return and it also under-performs the Communications industry average of 9.0%.
View our latest analysis for Ceragon Networks
Above you can see how the current ROCE for Ceragon Networks compares to its prior returns on capital, but there's only so much you can tell from the past. If you're interested, you can view the analysts predictions in our free report on analyst forecasts for the company.
How Are Returns Trending?
In terms of Ceragon Networks' historical ROCE movements, the trend isn't fantastic. To be more specific, ROCE has fallen from 13% over the last five years. On the other hand, the company has been employing more capital without a corresponding improvement in sales in the last year, which could suggest these investments are longer term plays. It may take some time before the company starts to see any change in earnings from these investments.
Another thing to note, Ceragon Networks has a high ratio of current liabilities to total assets of 42%. This can bring about some risks because the company is basically operating with a rather large reliance on its suppliers or other sorts of short-term creditors. Ideally we'd like to see this reduce as that would mean fewer obligations bearing risks.
The Bottom Line On Ceragon Networks' ROCE
To conclude, we've found that Ceragon Networks is reinvesting in the business, but returns have been falling. And investors appear hesitant that the trends will pick up because the stock has fallen 35% in the last five years. Therefore based on the analysis done in this article, we don't think Ceragon Networks has the makings of a multi-bagger.
One more thing: We've identified 2 warning signs with Ceragon Networks (at least 1 which is a bit concerning) , and understanding them would certainly be useful.
If you want to search for solid companies with great earnings, check out this free list of companies with good balance sheets and impressive returns on equity.
Have feedback on this article? Concerned about the content? Get in touch with us directly. Alternatively, email editorial-team (at) simplywallst.com.
This article by Simply Wall St is general in nature. We provide commentary based on historical data and analyst forecasts only using an unbiased methodology and our articles are not intended to be financial advice. It does not constitute a recommendation to buy or sell any stock, and does not take account of your objectives, or your financial situation. We aim to bring you long-term focused analysis driven by fundamental data. Note that our analysis may not factor in the latest price-sensitive company announcements or qualitative material. Simply Wall St has no position in any stocks mentioned.
