
 Yahoo Finance
 There Are Reasons To Feel Uneasy About Craneware's (LON:CRW) Returns On Capital
If you're not sure where to start when looking for the next multi-bagger, there are a few key trends you should keep an eye out for. Firstly, we'd want to identify a growing return on capital employed (ROCE) and then alongside that, an ever-increasing base of capital employed. Put simply, these types of businesses are compounding machines, meaning they are continually reinvesting their earnings at ever-higher rates of return. Having said that, from a first glance at Craneware (LON:CRW) we aren't jumping out of our chairs at how returns are trending, but let's have a deeper look.
What Is Return On Capital Employed (ROCE)?
For those that aren't sure what ROCE is, it measures the amount of pre-tax profits a company can generate from the capital employed in its business. The formula for this calculation on Craneware is:
Return on Capital Employed = Earnings Before Interest and Tax (EBIT) ÷ (Total Assets - Current Liabilities)
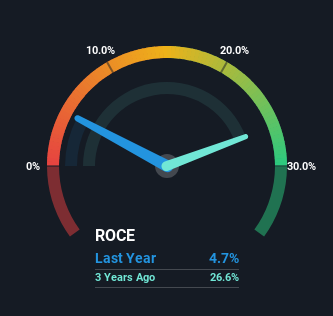
0.047 = US$20m ÷ (US$574m - US$154m) (Based on the trailing twelve months to December 2023).
So, Craneware has an ROCE of 4.7%. Ultimately, that's a low return and it under-performs the Healthcare Services industry average of 9.2%.
See our latest analysis for Craneware
In the above chart we have measured Craneware's prior ROCE against its prior performance, but the future is arguably more important. If you're interested, you can view the analysts predictions in our free analyst report for Craneware .
The Trend Of ROCE
When we looked at the ROCE trend at Craneware, we didn't gain much confidence. To be more specific, ROCE has fallen from 34% over the last five years. On the other hand, the company has been employing more capital without a corresponding improvement in sales in the last year, which could suggest these investments are longer term plays. It's worth keeping an eye on the company's earnings from here on to see if these investments do end up contributing to the bottom line.
On a related note, Craneware has decreased its current liabilities to 27% of total assets. That could partly explain why the ROCE has dropped. Effectively this means their suppliers or short-term creditors are funding less of the business, which reduces some elements of risk. Some would claim this reduces the business' efficiency at generating ROCE since it is now funding more of the operations with its own money.
The Key Takeaway
Bringing it all together, while we're somewhat encouraged by Craneware's reinvestment in its own business, we're aware that returns are shrinking. And investors appear hesitant that the trends will pick up because the stock has fallen 13% in the last five years. All in all, the inherent trends aren't typical of multi-baggers, so if that's what you're after, we think you might have more luck elsewhere.
Craneware could be trading at an attractive price in other respects, so you might find our free intrinsic value estimation for CRW on our platform quite valuable.
While Craneware isn't earning the highest return, check out this free list of companies that are earning high returns on equity with solid balance sheets.
Have feedback on this article? Concerned about the content? Get in touch with us directly. Alternatively, email editorial-team (at) simplywallst.com.
This article by Simply Wall St is general in nature. We provide commentary based on historical data and analyst forecasts only using an unbiased methodology and our articles are not intended to be financial advice. It does not constitute a recommendation to buy or sell any stock, and does not take account of your objectives, or your financial situation. We aim to bring you long-term focused analysis driven by fundamental data. Note that our analysis may not factor in the latest price-sensitive company announcements or qualitative material. Simply Wall St has no position in any stocks mentioned.
