
 Yahoo Finance
 Reasons Why Chart Industries (GTLS) is a Good Investment Pick
Chart Industries, Inc. GTLS can currently be considered a smart choice for investors seeking exposure in the machinery space. It boasts solid growth prospects, evident from positive revision in earnings estimates, and has solid fundamentals.
The Ball Ground, GA-based company currently has a Zacks Rank #2 (Buy) and a VGM Score of A. It belongs to the Zacks Manufacturing – General Industrial industry, which belongs to the broader Zacks Industrial Products sector.
Pro-growth policies of the government, infrastructure investments, growing use of e-retail, use of sophisticated technologies in manufacturing process, and new construction and remodeling activities aid the industry players.
Below we discussed why it is worth investing in Chart Industries.
Healthy Performance and Solid Growth Prospects: The company has surpassed estimates in two of the last four quarters, while lagged estimates in the other two, with a positive earnings surprise of 4.01%, on average.
In the last reported quarter, the company’s earnings of 77 cents per share increased 4.1% year over year. On a sequential basis, the bottom line expanded 13.2%. We believe that impressive financial results helped drive sentiments for the stock. Notably, the company’s shares gained 19.1% in the past three months, whereas the industry grew 17.2%.

In the quarters ahead, Chart Industries will likely gain from acquired assets, healthy contribution from its projects and margin enhancement actions. It predicts adjusted earnings of $2.70-$2.90 per share for 2019, whereas it reported $2.02 a year ago. For 2020, the company anticipates adjusted earnings (in the base business) of $4.75-$5.25.
Also, its earnings estimates for 2020 have been raised by 0.2% to $4.83 per share in the past 30 days. Meanwhile, estimates for 2019 have been unchanged at $2.78 during the same timeframe. Estimates suggest year-over-year growth of 37.6% for 2019 and 73.7% for 2020.
Chart Industries, Inc. Price and Consensus
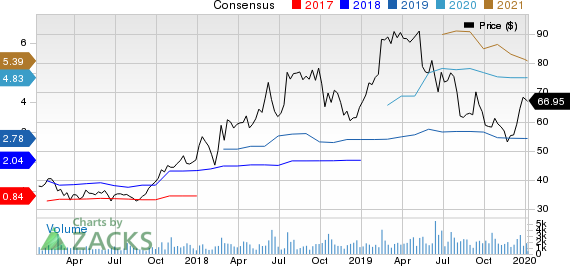
Chart Industries, Inc. price-consensus-chart | Chart Industries, Inc. Quote
Solid Revenue Prospects: Chart Industries is well-placed to gain from growth in liquefied natural gas (LNG) activities and specialty markets. Also, its globally diversifies business is a boon. Notably, it operates in Europe, the Americas and the Asia Pacific.
For 2019, the company anticipates revenues of $1.33-$1.35 billion, whereas it reported $1.08 billion in 2018. Meanwhile, revenues in 2020 are predicted to grow 21-24% year over year to $1,615-$1,680 million. Including the Calcasieu Pass project, organic sales in the year are expected to increase 13-15%.
The Zacks Consensus Estimate for Chart Industries’ revenues is pegged at $1.34 billion for 2019 and $1.64 billion for 2020. The consensus estimate for 2020 suggests year-over-year growth of 22.3%.
Acquired Assets: The company has been investing in acquisitions over time. In the first three quarters of 2019, Chart Industries used $603.9 million for acquisitions.
Notably, one of the significant buyouts of the company is that of the Industrial Air-X-Changers business of Harsco Corporation HSC in July 2019. The acquired assets are strengthening chart Industries’ businesses in the industrial energy and gas market.
Investment for Capacity Expansion: Addition of plants and properties to asset base and development of business remain priorities for Chart Industries. In the first nine months of 2019, the company invested $26.7 million on capital expenditure.
For 2019, Chart Industries predicts capital expenditure of $35-$40 million. A similar amount will be spent in 2020 to be used mainly for completing Italy-based LNG vehicle tank line and expansion of manufacturing capabilities in India.
Other Key Picks
Two other top-ranked stocks in the sector are Hickok Inc CRAWA and DXP Enterprises, Inc DXPE. While Hickok currently sports a Zacks Rank #1 (Strong Buy), DXP Enterprises carries a Zacks Rank #2. You can see the complete list of today’s Zacks #1 Rank stocks here.
In the past 60 days, earnings estimates for these stocks have improved for the current year. Further, positive earnings surprise for the last reported quarter was 15.56% for Hickok and 16.39% for DXP Enterprises.
Just Released: Zacks’ 7 Best Stocks for Today
Experts extracted 7 stocks from the list of 220 Zacks Rank #1 Strong Buys that has beaten the market more than 2X over with a stunning average gain of +24.6% per year.
These 7 were selected because of their superior potential for immediate breakout.
See these time-sensitive tickers now >>
Want the latest recommendations from Zacks Investment Research? Today, you can download 7 Best Stocks for the Next 30 Days. Click to get this free report
DXP Enterprises, Inc. (DXPE) : Free Stock Analysis Report
Chart Industries, Inc. (GTLS) : Free Stock Analysis Report
Harsco Corporation (HSC) : Free Stock Analysis Report
Hickok Inc. (CRAWA) : Free Stock Analysis Report
To read this article on Zacks.com click here.
Zacks Investment Research
