
 Yahoo Finance
 Recent 10% pullback isn't enough to hurt long-term Polarean Imaging (LON:POLX) shareholders, they're still up 59% over 5 years
It hasn't been the best quarter for Polarean Imaging plc (LON:POLX) shareholders, since the share price has fallen 13% in that time. Looking further back, the stock has generated good profits over five years. After all, the share price is up a market-beating 58% in that time. Unfortunately not all shareholders will have held it for the long term, so spare a thought for those caught in the 54% decline over the last twelve months.
While this past week has detracted from the company's five-year return, let's look at the recent trends of the underlying business and see if the gains have been in alignment.
Check out our latest analysis for Polarean Imaging
Polarean Imaging wasn't profitable in the last twelve months, it is unlikely we'll see a strong correlation between its share price and its earnings per share (EPS). Arguably revenue is our next best option. Shareholders of unprofitable companies usually expect strong revenue growth. Some companies are willing to postpone profitability to grow revenue faster, but in that case one does expect good top-line growth.
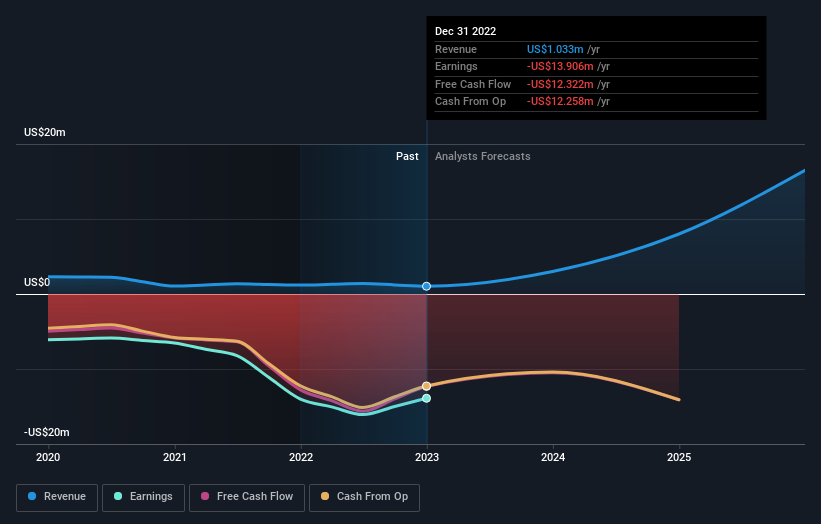
Over the last half decade Polarean Imaging's revenue has actually been trending down at about 12% per year. Even though revenue hasn't increased, the stock actually gained 10%, per year, during the same period. To us that suggests that there probably isn't a lot of correlation between the past revenue performance and the share price, but a closer look at analyst forecasts and the bottom line may well explain a lot.
The graphic below depicts how earnings and revenue have changed over time (unveil the exact values by clicking on the image).
You can see how its balance sheet has strengthened (or weakened) over time in this free interactive graphic.
A Different Perspective
We regret to report that Polarean Imaging shareholders are down 54% for the year. Unfortunately, that's worse than the broader market decline of 0.4%. However, it could simply be that the share price has been impacted by broader market jitters. It might be worth keeping an eye on the fundamentals, in case there's a good opportunity. On the bright side, long term shareholders have made money, with a gain of 10% per year over half a decade. It could be that the recent sell-off is an opportunity, so it may be worth checking the fundamental data for signs of a long term growth trend. It's always interesting to track share price performance over the longer term. But to understand Polarean Imaging better, we need to consider many other factors. For instance, we've identified 4 warning signs for Polarean Imaging (1 is concerning) that you should be aware of.
For those who like to find winning investments this free list of growing companies with recent insider purchasing, could be just the ticket.
Please note, the market returns quoted in this article reflect the market weighted average returns of stocks that currently trade on British exchanges.
Have feedback on this article? Concerned about the content? Get in touch with us directly. Alternatively, email editorial-team (at) simplywallst.com.
This article by Simply Wall St is general in nature. We provide commentary based on historical data and analyst forecasts only using an unbiased methodology and our articles are not intended to be financial advice. It does not constitute a recommendation to buy or sell any stock, and does not take account of your objectives, or your financial situation. We aim to bring you long-term focused analysis driven by fundamental data. Note that our analysis may not factor in the latest price-sensitive company announcements or qualitative material. Simply Wall St has no position in any stocks mentioned.
Join A Paid User Research Session
You’ll receive a US$30 Amazon Gift card for 1 hour of your time while helping us build better investing tools for the individual investors like yourself. Sign up here
