
 Yahoo Finance
 Is Redfin (NASDAQ:RDFN) Weighed On By Its Debt Load?

Legendary fund manager Li Lu (who Charlie Munger backed) once said, 'The biggest investment risk is not the volatility of prices, but whether you will suffer a permanent loss of capital. When we think about how risky a company is, we always like to look at its use of debt, since debt overload can lead to ruin. We can see that Redfin Corporation (NASDAQ:RDFN) does use debt in its business. But the more important question is: how much risk is that debt creating?
What Risk Does Debt Bring?
Debt is a tool to help businesses grow, but if a business is incapable of paying off its lenders, then it exists at their mercy. In the worst case scenario, a company can go bankrupt if it cannot pay its creditors. However, a more common (but still painful) scenario is that it has to raise new equity capital at a low price, thus permanently diluting shareholders. Having said that, the most common situation is where a company manages its debt reasonably well - and to its own advantage. The first step when considering a company's debt levels is to consider its cash and debt together.
See our latest analysis for Redfin
What Is Redfin's Debt?
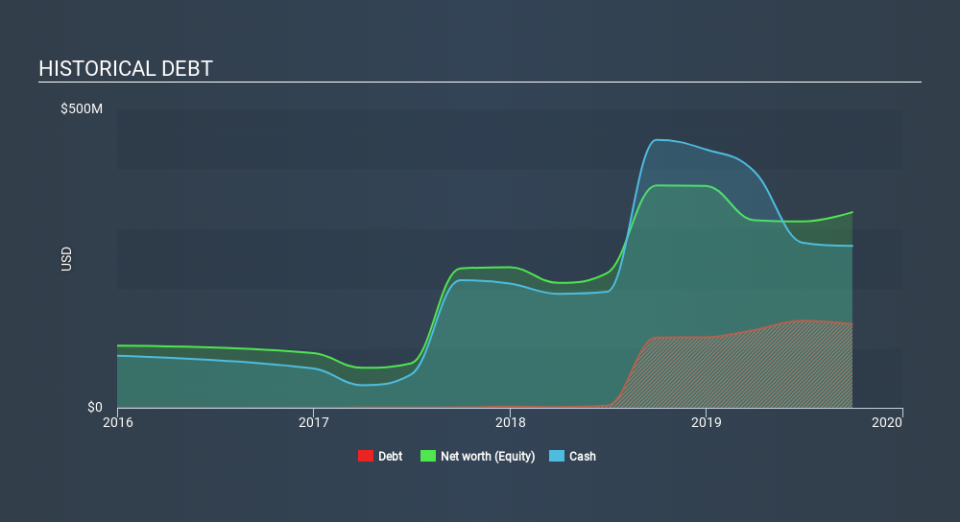
The image below, which you can click on for greater detail, shows that at September 2019 Redfin had debt of US$140.1m, up from US$117.9m in one year. But it also has US$271.3m in cash to offset that, meaning it has US$131.1m net cash.
How Strong Is Redfin's Balance Sheet?
According to the last reported balance sheet, Redfin had liabilities of US$93.0m due within 12 months, and liabilities of US$171.2m due beyond 12 months. Offsetting this, it had US$271.3m in cash and US$24.4m in receivables that were due within 12 months. So it can boast US$31.5m more liquid assets than total liabilities.
Having regard to Redfin's size, it seems that its liquid assets are well balanced with its total liabilities. So it's very unlikely that the US$1.97b company is short on cash, but still worth keeping an eye on the balance sheet. Simply put, the fact that Redfin has more cash than debt is arguably a good indication that it can manage its debt safely. When analysing debt levels, the balance sheet is the obvious place to start. But ultimately the future profitability of the business will decide if Redfin can strengthen its balance sheet over time. So if you want to see what the professionals think, you might find this free report on analyst profit forecasts to be interesting.
In the last year Redfin wasn't profitable at an EBIT level, but managed to grow its revenue by46%, to US$671m. Shareholders probably have their fingers crossed that it can grow its way to profits.
So How Risky Is Redfin?
By their very nature companies that are losing money are more risky than those with a long history of profitability. And in the last year Redfin had negative earnings before interest and tax (EBIT), truth be told. And over the same period it saw negative free cash outflow of US$164m and booked a US$85m accounting loss. But at least it has US$131.1m on the balance sheet to spend on growth, near-term. Redfin's revenue growth shone bright over the last year, so it may well be in a position to turn a profit in due course. Pre-profit companies are often risky, but they can also offer great rewards. When we look at a riskier company, we like to check how their profits (or losses) are trending over time. Today, we're providing readers this interactive graph showing how Redfin's profit, revenue, and operating cashflow have changed over the last few years.
If you're interested in investing in businesses that can grow profits without the burden of debt, then check out this free list of growing businesses that have net cash on the balance sheet.
If you spot an error that warrants correction, please contact the editor at editorial-team@simplywallst.com. This article by Simply Wall St is general in nature. It does not constitute a recommendation to buy or sell any stock, and does not take account of your objectives, or your financial situation. Simply Wall St has no position in the stocks mentioned.
We aim to bring you long-term focused research analysis driven by fundamental data. Note that our analysis may not factor in the latest price-sensitive company announcements or qualitative material. Thank you for reading.
