
 Yahoo Finance
 Reflecting on Rathbone Brothers' (LON:RAT) Share Price Returns Over The Last Three Years

Rathbone Brothers Plc (LON:RAT) shareholders should be happy to see the share price up 13% in the last quarter. But that doesn't help the fact that the three year return is less impressive. After all, the share price is down 40% in the last three years, significantly under-performing the market.
View our latest analysis for Rathbone Brothers
There is no denying that markets are sometimes efficient, but prices do not always reflect underlying business performance. One flawed but reasonable way to assess how sentiment around a company has changed is to compare the earnings per share (EPS) with the share price.
During the three years that the share price fell, Rathbone Brothers' earnings per share (EPS) dropped by 11% each year. The share price decline of 16% is actually steeper than the EPS slippage. So it seems the market was too confident about the business, in the past.
The graphic below depicts how EPS has changed over time (unveil the exact values by clicking on the image).
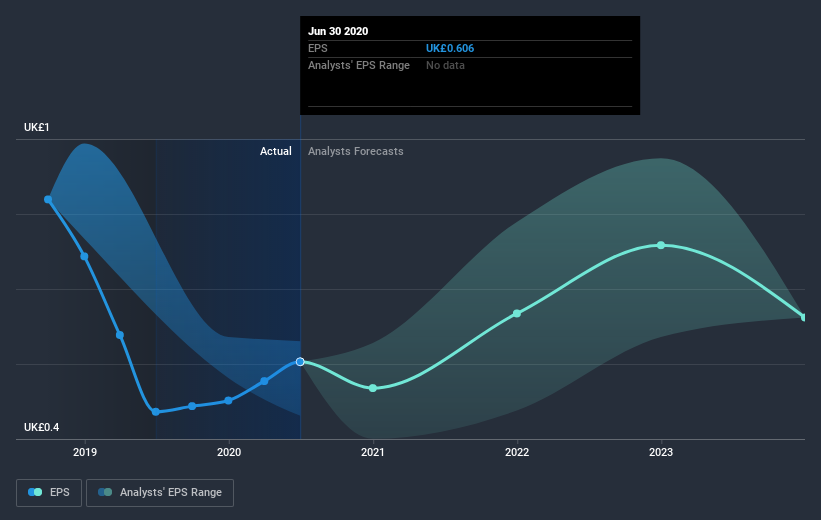
We know that Rathbone Brothers has improved its bottom line lately, but is it going to grow revenue? This free report showing analyst revenue forecasts should help you figure out if the EPS growth can be sustained.
What About Dividends?
As well as measuring the share price return, investors should also consider the total shareholder return (TSR). The TSR is a return calculation that accounts for the value of cash dividends (assuming that any dividend received was reinvested) and the calculated value of any discounted capital raisings and spin-offs. Arguably, the TSR gives a more comprehensive picture of the return generated by a stock. We note that for Rathbone Brothers the TSR over the last 3 years was -34%, which is better than the share price return mentioned above. And there's no prize for guessing that the dividend payments largely explain the divergence!
A Different Perspective
We regret to report that Rathbone Brothers shareholders are down 21% for the year (even including dividends). Unfortunately, that's worse than the broader market decline of 13%. Having said that, it's inevitable that some stocks will be oversold in a falling market. The key is to keep your eyes on the fundamental developments. Regrettably, last year's performance caps off a bad run, with the shareholders facing a total loss of 3.1% per year over five years. Generally speaking long term share price weakness can be a bad sign, though contrarian investors might want to research the stock in hope of a turnaround. While it is well worth considering the different impacts that market conditions can have on the share price, there are other factors that are even more important. Consider risks, for instance. Every company has them, and we've spotted 2 warning signs for Rathbone Brothers you should know about.
For those who like to find winning investments this free list of growing companies with recent insider purchasing, could be just the ticket.
Please note, the market returns quoted in this article reflect the market weighted average returns of stocks that currently trade on GB exchanges.
This article by Simply Wall St is general in nature. It does not constitute a recommendation to buy or sell any stock, and does not take account of your objectives, or your financial situation. We aim to bring you long-term focused analysis driven by fundamental data. Note that our analysis may not factor in the latest price-sensitive company announcements or qualitative material. Simply Wall St has no position in any stocks mentioned.
Have feedback on this article? Concerned about the content? Get in touch with us directly. Alternatively, email editorial-team@simplywallst.com.
