
 Yahoo Finance
 Reflecting on Saga's (LON:SAGA) Share Price Returns Over The Last Five Years
Long term investing works well, but it doesn't always work for each individual stock. We really hate to see fellow investors lose their hard-earned money. Imagine if you held Saga plc (LON:SAGA) for half a decade as the share price tanked 87%. Unfortunately the share price momentum is still quite negative, with prices down 8.5% in thirty days.
We really hope anyone holding through that price crash has a diversified portfolio. Even when you lose money, you don't have to lose the lesson.
Check out our latest analysis for Saga
While the efficient markets hypothesis continues to be taught by some, it has been proven that markets are over-reactive dynamic systems, and investors are not always rational. One imperfect but simple way to consider how the market perception of a company has shifted is to compare the change in the earnings per share (EPS) with the share price movement.
We know that Saga has been profitable in the past. However, it made a loss in the last twelve months, suggesting profit may be an unreliable metric at this stage. Other metrics might give us a better handle on how its value is changing over time.
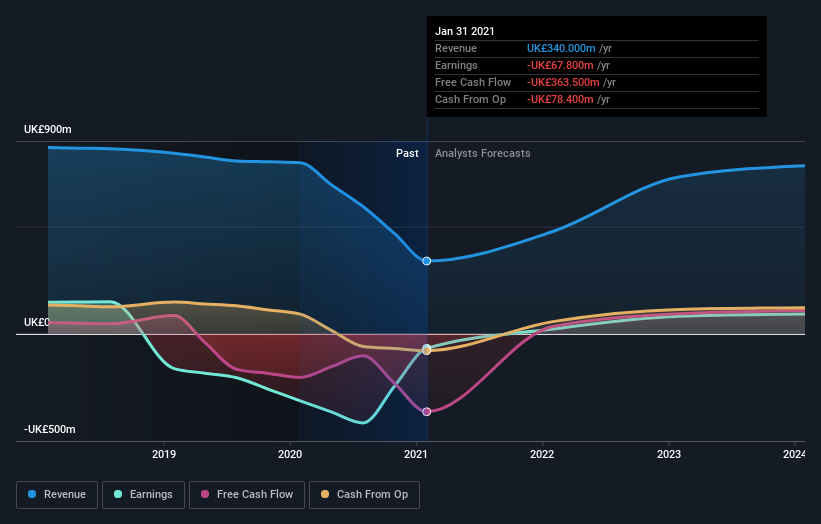
Arguably, the revenue drop of 11% a year for half a decade suggests that the company can't grow in the long term. That could explain the weak share price.
You can see how earnings and revenue have changed over time in the image below (click on the chart to see the exact values).
It's good to see that there was some significant insider buying in the last three months. That's a positive. On the other hand, we think the revenue and earnings trends are much more meaningful measures of the business. This free report showing analyst forecasts should help you form a view on Saga
What about the Total Shareholder Return (TSR)?
We've already covered Saga's share price action, but we should also mention its total shareholder return (TSR). The TSR attempts to capture the value of dividends (as if they were reinvested) as well as any spin-offs or discounted capital raisings offered to shareholders. Its history of dividend payouts mean that Saga's TSR, which was a 83% drop over the last 5 years, was not as bad as the share price return.
A Different Perspective
It's nice to see that Saga shareholders have received a total shareholder return of 75% over the last year. Notably the five-year annualised TSR loss of 13% per year compares very unfavourably with the recent share price performance. We generally put more weight on the long term performance over the short term, but the recent improvement could hint at a (positive) inflection point within the business. It's always interesting to track share price performance over the longer term. But to understand Saga better, we need to consider many other factors. To that end, you should learn about the 2 warning signs we've spotted with Saga (including 1 which doesn't sit too well with us) .
Saga is not the only stock that insiders are buying. For those who like to find winning investments this free list of growing companies with recent insider purchasing, could be just the ticket.
Please note, the market returns quoted in this article reflect the market weighted average returns of stocks that currently trade on GB exchanges.
This article by Simply Wall St is general in nature. It does not constitute a recommendation to buy or sell any stock, and does not take account of your objectives, or your financial situation. We aim to bring you long-term focused analysis driven by fundamental data. Note that our analysis may not factor in the latest price-sensitive company announcements or qualitative material. Simply Wall St has no position in any stocks mentioned.
Have feedback on this article? Concerned about the content? Get in touch with us directly. Alternatively, email editorial-team (at) simplywallst.com.
