
 Yahoo Finance
 Reflecting on US Masters Residential Property Fund's (ASX:URF) Share Price Returns Over The Last Five Years
Over the last month the US Masters Residential Property Fund (ASX:URF) has been much stronger than before, rebounding by 32%. But that doesn't change the fact that the returns over the last half decade have been stomach churning. Indeed, the share price is down a whopping 87% in that time. So we don't gain too much confidence from the recent recovery. The fundamental business performance will ultimately determine if the turnaround can be sustained.
We really hope anyone holding through that price crash has a diversified portfolio. Even when you lose money, you don't have to lose the lesson.
See our latest analysis for US Masters Residential Property Fund
Because US Masters Residential Property Fund made a loss in the last twelve months, we think the market is probably more focussed on revenue and revenue growth, at least for now. Shareholders of unprofitable companies usually expect strong revenue growth. That's because fast revenue growth can be easily extrapolated to forecast profits, often of considerable size.
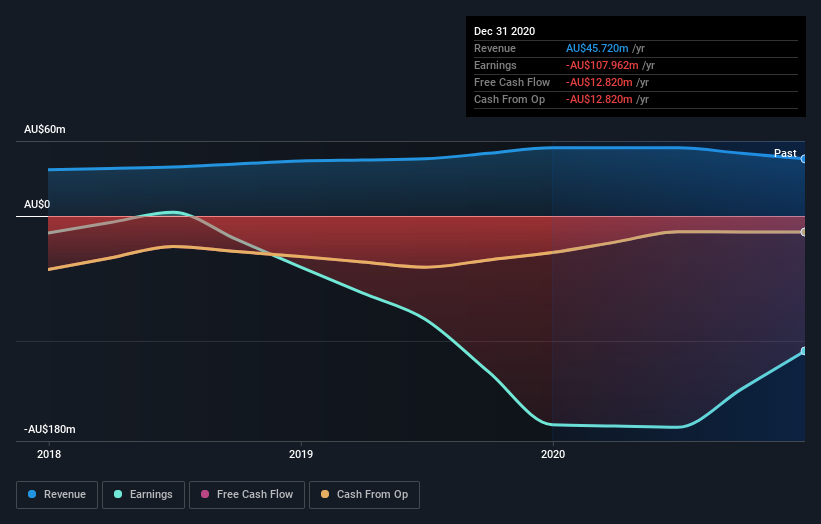
In the last half decade, US Masters Residential Property Fund saw its revenue increase by 9.7% per year. That's a fairly respectable growth rate. So the stock price fall of 13% per year seems pretty steep. The market can be a harsh master when your company is losing money and revenue growth disappoints.
You can see how earnings and revenue have changed over time in the image below (click on the chart to see the exact values).
Take a more thorough look at US Masters Residential Property Fund's financial health with this free report on its balance sheet.
What about the Total Shareholder Return (TSR)?
We'd be remiss not to mention the difference between US Masters Residential Property Fund's total shareholder return (TSR) and its share price return. The TSR is a return calculation that accounts for the value of cash dividends (assuming that any dividend received was reinvested) and the calculated value of any discounted capital raisings and spin-offs. Dividends have been really beneficial for US Masters Residential Property Fund shareholders, and that cash payout explains why its total shareholder loss of 85%, over the last 5 years, isn't as bad as the share price return.
A Different Perspective
US Masters Residential Property Fund provided a TSR of 17% over the last twelve months. But that return falls short of the market. On the bright side, that's still a gain, and it is certainly better than the yearly loss of about 13% endured over half a decade. So this might be a sign the business has turned its fortunes around. While it is well worth considering the different impacts that market conditions can have on the share price, there are other factors that are even more important. Case in point: We've spotted 4 warning signs for US Masters Residential Property Fund you should be aware of, and 1 of them is significant.
But note: US Masters Residential Property Fund may not be the best stock to buy. So take a peek at this free list of interesting companies with past earnings growth (and further growth forecast).
Please note, the market returns quoted in this article reflect the market weighted average returns of stocks that currently trade on AU exchanges.
This article by Simply Wall St is general in nature. It does not constitute a recommendation to buy or sell any stock, and does not take account of your objectives, or your financial situation. We aim to bring you long-term focused analysis driven by fundamental data. Note that our analysis may not factor in the latest price-sensitive company announcements or qualitative material. Simply Wall St has no position in any stocks mentioned.
Have feedback on this article? Concerned about the content? Get in touch with us directly. Alternatively, email editorial-team (at) simplywallst.com.
