
 Yahoo Finance
 Is RELX PLC’s (LON:REL) 22% Return On Capital Employed Good News?

Want to participate in a short research study? Help shape the future of investing tools and receive a $20 prize!
Today we’ll evaluate RELX PLC (LON:REL) to determine whether it could have potential as an investment idea. Specifically, we’ll consider its Return On Capital Employed (ROCE), since that will give us an insight into how efficiently the business can generate profits from the capital it requires.
Firstly, we’ll go over how we calculate ROCE. Next, we’ll compare it to others in its industry. Finally, we’ll look at how its current liabilities affect its ROCE.
What is Return On Capital Employed (ROCE)?
ROCE is a measure of a company’s yearly pre-tax profit (its return), relative to the capital employed in the business. In general, businesses with a higher ROCE are usually better quality. Overall, it is a valuable metric that has its flaws. Renowned investment researcher Michael Mauboussin has suggested that a high ROCE can indicate that ‘one dollar invested in the company generates value of more than one dollar’.
How Do You Calculate Return On Capital Employed?
Analysts use this formula to calculate return on capital employed:
Return on Capital Employed = Earnings Before Interest and Tax (EBIT) ÷ (Total Assets – Current Liabilities)
Or for RELX:
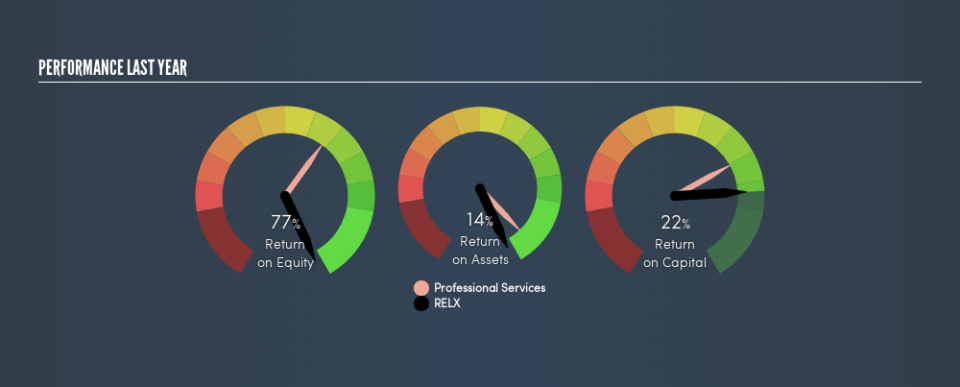
0.22 = UK£1.9b ÷ (UK£13b – UK£4.7b) (Based on the trailing twelve months to June 2018.)
Therefore, RELX has an ROCE of 22%.
See our latest analysis for RELX
Does RELX Have A Good ROCE?
When making comparisons between similar businesses, investors may find ROCE useful. We can see RELX’s ROCE is around the 22% average reported by the Professional Services industry. Putting aside its position relative to its industry for now, in absolute terms, RELX’s ROCE is currently very good.
It is important to remember that ROCE shows past performance, and is not necessarily predictive. ROCE can be misleading for companies in cyclical industries, with returns looking impressive during the boom times, but very weak during the busts. This is because ROCE only looks at one year, instead of considering returns across a whole cycle. What happens in the future is pretty important for investors, so we have prepared a free report on analyst forecasts for RELX.
RELX’s Current Liabilities And Their Impact On Its ROCE
Current liabilities are short term bills and invoices that need to be paid in 12 months or less. The ROCE equation subtracts current liabilities from capital employed, so a company with a lot of current liabilities appears to have less capital employed, and a higher ROCE than otherwise. To check the impact of this, we calculate if a company has high current liabilities relative to its total assets.
RELX has total assets of UK£13b and current liabilities of UK£4.7b. As a result, its current liabilities are equal to approximately 36% of its total assets. RELX’s ROCE is boosted somewhat by its middling amount of current liabilities.
The Bottom Line On RELX’s ROCE
Despite this, it reports a high ROCE, and may be worth investigating further. Of course, you might find a fantastic investment by looking at a few good candidates. So take a peek at this free list of companies with modest (or no) debt, trading on a P/E below 20.
For those who like to find winning investments this free list of growing companies with recent insider purchasing, could be just the ticket.
We aim to bring you long-term focused research analysis driven by fundamental data. Note that our analysis may not factor in the latest price-sensitive company announcements or qualitative material.
If you spot an error that warrants correction, please contact the editor at editorial-team@simplywallst.com. This article by Simply Wall St is general in nature. It does not constitute a recommendation to buy or sell any stock, and does not take account of your objectives, or your financial situation. Simply Wall St has no position in the stocks mentioned. Thank you for reading.
