
 Yahoo Finance
 Is Renewi plc's (LON:RWI) ROE Of 4.5% Concerning?
Many investors are still learning about the various metrics that can be useful when analysing a stock. This article is for those who would like to learn about Return On Equity (ROE). We'll use ROE to examine Renewi plc (LON:RWI), by way of a worked example.
Return on equity or ROE is an important factor to be considered by a shareholder because it tells them how effectively their capital is being reinvested. Simply put, it is used to assess the profitability of a company in relation to its equity capital.
View our latest analysis for Renewi
How To Calculate Return On Equity?
The formula for return on equity is:
Return on Equity = Net Profit (from continuing operations) ÷ Shareholders' Equity
So, based on the above formula, the ROE for Renewi is:
4.5% = €11m ÷ €243m (Based on the trailing twelve months to March 2021).
The 'return' is the yearly profit. So, this means that for every £1 of its shareholder's investments, the company generates a profit of £0.05.
Does Renewi Have A Good ROE?
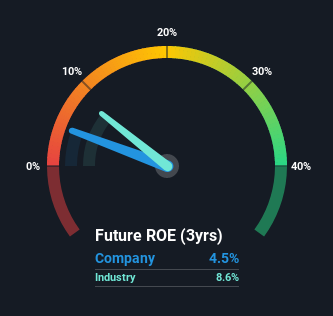
Arguably the easiest way to assess company's ROE is to compare it with the average in its industry. The limitation of this approach is that some companies are quite different from others, even within the same industry classification. As is clear from the image below, Renewi has a lower ROE than the average (8.6%) in the Commercial Services industry.
Unfortunately, that's sub-optimal. However, a low ROE is not always bad. If the company's debt levels are moderate to low, then there's still a chance that returns can be improved via the use of financial leverage. When a company has low ROE but high debt levels, we would be cautious as the risk involved is too high. You can see the 2 risks we have identified for Renewi by visiting our risks dashboard for free on our platform here.
How Does Debt Impact Return On Equity?
Virtually all companies need money to invest in the business, to grow profits. That cash can come from retained earnings, issuing new shares (equity), or debt. In the case of the first and second options, the ROE will reflect this use of cash, for growth. In the latter case, the use of debt will improve the returns, but will not change the equity. Thus the use of debt can improve ROE, albeit along with extra risk in the case of stormy weather, metaphorically speaking.
Combining Renewi's Debt And Its 4.5% Return On Equity
It's worth noting the high use of debt by Renewi, leading to its debt to equity ratio of 1.94. With a fairly low ROE, and significant use of debt, it's hard to get excited about this business at the moment. Debt does bring extra risk, so it's only really worthwhile when a company generates some decent returns from it.
Conclusion
Return on equity is one way we can compare its business quality of different companies. A company that can achieve a high return on equity without debt could be considered a high quality business. If two companies have around the same level of debt to equity, and one has a higher ROE, I'd generally prefer the one with higher ROE.
But ROE is just one piece of a bigger puzzle, since high quality businesses often trade on high multiples of earnings. The rate at which profits are likely to grow, relative to the expectations of profit growth reflected in the current price, must be considered, too. So you might want to take a peek at this data-rich interactive graph of forecasts for the company.
If you would prefer check out another company -- one with potentially superior financials -- then do not miss this free list of interesting companies, that have HIGH return on equity and low debt.
This article by Simply Wall St is general in nature. We provide commentary based on historical data and analyst forecasts only using an unbiased methodology and our articles are not intended to be financial advice. It does not constitute a recommendation to buy or sell any stock, and does not take account of your objectives, or your financial situation. We aim to bring you long-term focused analysis driven by fundamental data. Note that our analysis may not factor in the latest price-sensitive company announcements or qualitative material. Simply Wall St has no position in any stocks mentioned.
Have feedback on this article? Concerned about the content? Get in touch with us directly. Alternatively, email editorial-team (at) simplywallst.com.
