
 Yahoo Finance
 Renishaw First Half 2023 Earnings: EPS: UK£0.88 (vs UK£0.94 in 1H 2022)
Renishaw (LON:RSW) First Half 2023 Results
Key Financial Results
Revenue: UK£347.7m (up 6.9% from 1H 2022).
Net income: UK£64.1m (down 6.5% from 1H 2022).
Profit margin: 18% (down from 21% in 1H 2022). The decrease in margin was driven by higher expenses.
EPS: UK£0.88 (down from UK£0.94 in 1H 2022).
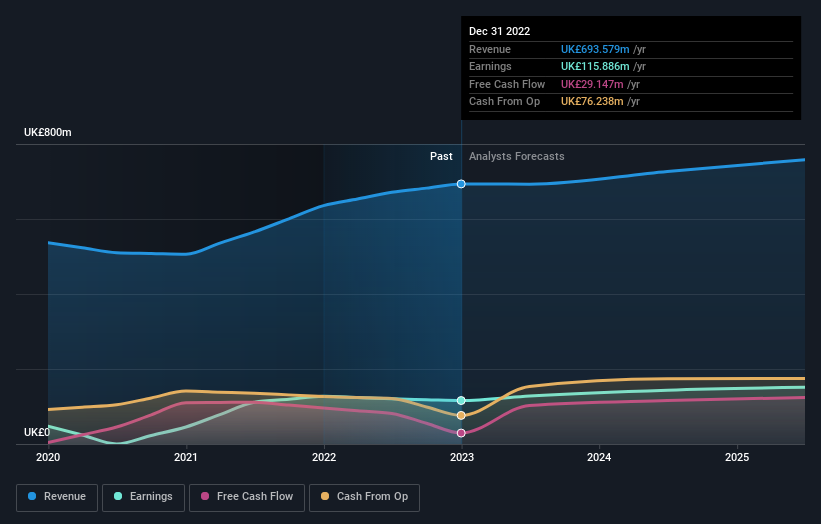
All figures shown in the chart above are for the trailing 12 month (TTM) period
Renishaw Earnings Insights
Looking ahead, revenue is forecast to grow 4.3% p.a. on average during the next 3 years, compared to a 6.2% growth forecast for the Electronic industry in the United Kingdom.
Performance of the British Electronic industry.
The company's shares are up 4.6% from a week ago.
Balance Sheet Analysis
Just as investors must consider earnings, it is also important to take into account the strength of a company's balance sheet. We've done some analysis and you can see our take on Renishaw's balance sheet.
Have feedback on this article? Concerned about the content? Get in touch with us directly. Alternatively, email editorial-team (at) simplywallst.com.
This article by Simply Wall St is general in nature. We provide commentary based on historical data and analyst forecasts only using an unbiased methodology and our articles are not intended to be financial advice. It does not constitute a recommendation to buy or sell any stock, and does not take account of your objectives, or your financial situation. We aim to bring you long-term focused analysis driven by fundamental data. Note that our analysis may not factor in the latest price-sensitive company announcements or qualitative material. Simply Wall St has no position in any stocks mentioned.
Join A Paid User Research Session
You’ll receive a US$30 Amazon Gift card for 1 hour of your time while helping us build better investing tools for the individual investors like yourself. Sign up here
