
 Yahoo Finance
 These Return Metrics Don't Make OPG Power Ventures (LON:OPG) Look Too Strong
What underlying fundamental trends can indicate that a company might be in decline? Businesses in decline often have two underlying trends, firstly, a declining return on capital employed (ROCE) and a declining base of capital employed. This indicates to us that the business is not only shrinking the size of its net assets, but its returns are falling as well. In light of that, from a first glance at OPG Power Ventures (LON:OPG), we've spotted some signs that it could be struggling, so let's investigate.
What Is Return On Capital Employed (ROCE)?
Just to clarify if you're unsure, ROCE is a metric for evaluating how much pre-tax income (in percentage terms) a company earns on the capital invested in its business. To calculate this metric for OPG Power Ventures, this is the formula:
Return on Capital Employed = Earnings Before Interest and Tax (EBIT) ÷ (Total Assets - Current Liabilities)
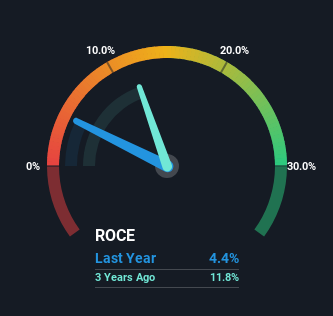
0.044 = UK£9.3m ÷ (UK£262m - UK£50m) (Based on the trailing twelve months to September 2023).
Thus, OPG Power Ventures has an ROCE of 4.4%. Ultimately, that's a low return and it under-performs the Electric Utilities industry average of 9.1%.
See our latest analysis for OPG Power Ventures
In the above chart we have measured OPG Power Ventures' prior ROCE against its prior performance, but the future is arguably more important. If you're interested, you can view the analysts predictions in our free report on analyst forecasts for the company.
What Can We Tell From OPG Power Ventures' ROCE Trend?
In terms of OPG Power Ventures' historical ROCE movements, the trend doesn't inspire confidence. To be more specific, the ROCE was 10% five years ago, but since then it has dropped noticeably. And on the capital employed front, the business is utilizing roughly the same amount of capital as it was back then. Since returns are falling and the business has the same amount of assets employed, this can suggest it's a mature business that hasn't had much growth in the last five years. If these trends continue, we wouldn't expect OPG Power Ventures to turn into a multi-bagger.
In Conclusion...
All in all, the lower returns from the same amount of capital employed aren't exactly signs of a compounding machine. It should come as no surprise then that the stock has fallen 58% over the last five years, so it looks like investors are recognizing these changes. That being the case, unless the underlying trends revert to a more positive trajectory, we'd consider looking elsewhere.
Since virtually every company faces some risks, it's worth knowing what they are, and we've spotted 4 warning signs for OPG Power Ventures (of which 1 is concerning!) that you should know about.
For those who like to invest in solid companies, check out this free list of companies with solid balance sheets and high returns on equity.
Have feedback on this article? Concerned about the content? Get in touch with us directly. Alternatively, email editorial-team (at) simplywallst.com.
This article by Simply Wall St is general in nature. We provide commentary based on historical data and analyst forecasts only using an unbiased methodology and our articles are not intended to be financial advice. It does not constitute a recommendation to buy or sell any stock, and does not take account of your objectives, or your financial situation. We aim to bring you long-term focused analysis driven by fundamental data. Note that our analysis may not factor in the latest price-sensitive company announcements or qualitative material. Simply Wall St has no position in any stocks mentioned.
