
 Yahoo Finance
 The Return Trends At DRDGOLD (NYSE:DRD) Look Promising
Did you know there are some financial metrics that can provide clues of a potential multi-bagger? Amongst other things, we'll want to see two things; firstly, a growing return on capital employed (ROCE) and secondly, an expansion in the company's amount of capital employed. Put simply, these types of businesses are compounding machines, meaning they are continually reinvesting their earnings at ever-higher rates of return. So on that note, DRDGOLD (NYSE:DRD) looks quite promising in regards to its trends of return on capital.
Understanding Return On Capital Employed (ROCE)
If you haven't worked with ROCE before, it measures the 'return' (pre-tax profit) a company generates from capital employed in its business. Analysts use this formula to calculate it for DRDGOLD:
Return on Capital Employed = Earnings Before Interest and Tax (EBIT) ÷ (Total Assets - Current Liabilities)
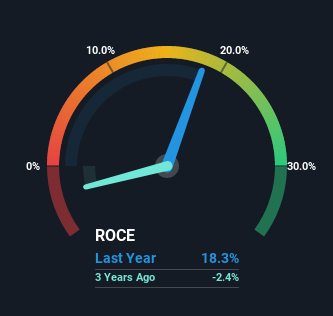
0.18 = R1.1b ÷ (R6.6b - R554m) (Based on the trailing twelve months to December 2021).
So, DRDGOLD has an ROCE of 18%. In absolute terms, that's a pretty normal return, and it's somewhat close to the Metals and Mining industry average of 21%.
See our latest analysis for DRDGOLD
In the above chart we have measured DRDGOLD's prior ROCE against its prior performance, but the future is arguably more important. If you'd like, you can check out the forecasts from the analysts covering DRDGOLD here for free.
What Can We Tell From DRDGOLD's ROCE Trend?
Investors would be pleased with what's happening at DRDGOLD. Over the last five years, returns on capital employed have risen substantially to 18%. The company is effectively making more money per dollar of capital used, and it's worth noting that the amount of capital has increased too, by 190%. So we're very much inspired by what we're seeing at DRDGOLD thanks to its ability to profitably reinvest capital.
The Bottom Line On DRDGOLD's ROCE
In summary, it's great to see that DRDGOLD can compound returns by consistently reinvesting capital at increasing rates of return, because these are some of the key ingredients of those highly sought after multi-baggers. Since the stock has returned a solid 44% to shareholders over the last five years, it's fair to say investors are beginning to recognize these changes. So given the stock has proven it has promising trends, it's worth researching the company further to see if these trends are likely to persist.
One more thing, we've spotted 2 warning signs facing DRDGOLD that you might find interesting.
For those who like to invest in solid companies, check out this free list of companies with solid balance sheets and high returns on equity.
Have feedback on this article? Concerned about the content? Get in touch with us directly. Alternatively, email editorial-team (at) simplywallst.com.
This article by Simply Wall St is general in nature. We provide commentary based on historical data and analyst forecasts only using an unbiased methodology and our articles are not intended to be financial advice. It does not constitute a recommendation to buy or sell any stock, and does not take account of your objectives, or your financial situation. We aim to bring you long-term focused analysis driven by fundamental data. Note that our analysis may not factor in the latest price-sensitive company announcements or qualitative material. Simply Wall St has no position in any stocks mentioned.
Join A Paid User Research Session
You’ll receive a US$30 Amazon Gift card for 1 hour of your time while helping us build better investing tools for the individual investors like yourself. Sign up here
