
 Yahoo Finance
 The Return Trends At Hayward Holdings (NYSE:HAYW) Look Promising
Did you know there are some financial metrics that can provide clues of a potential multi-bagger? Typically, we'll want to notice a trend of growing return on capital employed (ROCE) and alongside that, an expanding base of capital employed. Put simply, these types of businesses are compounding machines, meaning they are continually reinvesting their earnings at ever-higher rates of return. So when we looked at Hayward Holdings (NYSE:HAYW) and its trend of ROCE, we really liked what we saw.
Understanding Return On Capital Employed (ROCE)
If you haven't worked with ROCE before, it measures the 'return' (pre-tax profit) a company generates from capital employed in its business. The formula for this calculation on Hayward Holdings is:
Return on Capital Employed = Earnings Before Interest and Tax (EBIT) ÷ (Total Assets - Current Liabilities)
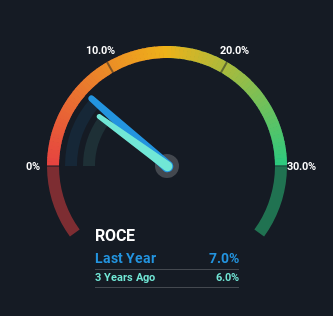
0.07 = US$188m ÷ (US$2.9b - US$240m) (Based on the trailing twelve months to December 2023).
Therefore, Hayward Holdings has an ROCE of 7.0%. Ultimately, that's a low return and it under-performs the Building industry average of 17%.
See our latest analysis for Hayward Holdings
In the above chart we have measured Hayward Holdings' prior ROCE against its prior performance, but the future is arguably more important. If you're interested, you can view the analysts predictions in our free analyst report for Hayward Holdings .
The Trend Of ROCE
Hayward Holdings is showing promise given that its ROCE is trending up and to the right. More specifically, while the company has kept capital employed relatively flat over the last four years, the ROCE has climbed 108% in that same time. So our take on this is that the business has increased efficiencies to generate these higher returns, all the while not needing to make any additional investments. It's worth looking deeper into this though because while it's great that the business is more efficient, it might also mean that going forward the areas to invest internally for the organic growth are lacking.
The Key Takeaway
In summary, we're delighted to see that Hayward Holdings has been able to increase efficiencies and earn higher rates of return on the same amount of capital. Given the stock has declined 31% in the last three years, this could be a good investment if the valuation and other metrics are also appealing. With that in mind, we believe the promising trends warrant this stock for further investigation.
Hayward Holdings does have some risks, we noticed 2 warning signs (and 1 which is potentially serious) we think you should know about.
While Hayward Holdings may not currently earn the highest returns, we've compiled a list of companies that currently earn more than 25% return on equity. Check out this free list here.
Have feedback on this article? Concerned about the content? Get in touch with us directly. Alternatively, email editorial-team (at) simplywallst.com.
This article by Simply Wall St is general in nature. We provide commentary based on historical data and analyst forecasts only using an unbiased methodology and our articles are not intended to be financial advice. It does not constitute a recommendation to buy or sell any stock, and does not take account of your objectives, or your financial situation. We aim to bring you long-term focused analysis driven by fundamental data. Note that our analysis may not factor in the latest price-sensitive company announcements or qualitative material. Simply Wall St has no position in any stocks mentioned.
