
 Yahoo Finance
 The Return Trends At Ho Wah Genting Berhad (KLSE:HWGB) Look Promising
There are a few key trends to look for if we want to identify the next multi-bagger. One common approach is to try and find a company with returns on capital employed (ROCE) that are increasing, in conjunction with a growing amount of capital employed. Ultimately, this demonstrates that it's a business that is reinvesting profits at increasing rates of return. So when we looked at Ho Wah Genting Berhad (KLSE:HWGB) and its trend of ROCE, we really liked what we saw.
Understanding Return On Capital Employed (ROCE)
For those who don't know, ROCE is a measure of a company's yearly pre-tax profit (its return), relative to the capital employed in the business. To calculate this metric for Ho Wah Genting Berhad, this is the formula:
Return on Capital Employed = Earnings Before Interest and Tax (EBIT) ÷ (Total Assets - Current Liabilities)
0.025 = RM2.3m ÷ (RM177m - RM84m) (Based on the trailing twelve months to July 2022).
Therefore, Ho Wah Genting Berhad has an ROCE of 2.5%. Ultimately, that's a low return and it under-performs the Electrical industry average of 8.6%.
Check out our latest analysis for Ho Wah Genting Berhad
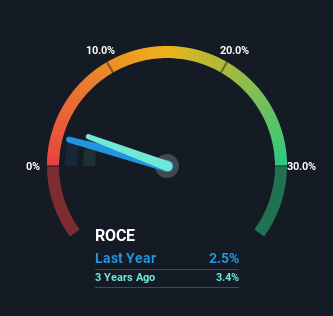
Historical performance is a great place to start when researching a stock so above you can see the gauge for Ho Wah Genting Berhad's ROCE against it's prior returns. If you want to delve into the historical earnings, revenue and cash flow of Ho Wah Genting Berhad, check out these free graphs here.
What The Trend Of ROCE Can Tell Us
The fact that Ho Wah Genting Berhad is now generating some pre-tax profits from its prior investments is very encouraging. Shareholders would no doubt be pleased with this because the business was loss-making five years ago but is is now generating 2.5% on its capital. In addition to that, Ho Wah Genting Berhad is employing 56% more capital than previously which is expected of a company that's trying to break into profitability. We like this trend, because it tells us the company has profitable reinvestment opportunities available to it, and if it continues going forward that can lead to a multi-bagger performance.
On a separate but related note, it's important to know that Ho Wah Genting Berhad has a current liabilities to total assets ratio of 47%, which we'd consider pretty high. This can bring about some risks because the company is basically operating with a rather large reliance on its suppliers or other sorts of short-term creditors. While it's not necessarily a bad thing, it can be beneficial if this ratio is lower.
In Conclusion...
Overall, Ho Wah Genting Berhad gets a big tick from us thanks in most part to the fact that it is now profitable and is reinvesting in its business. And since the stock has fallen 55% over the last five years, there might be an opportunity here. That being the case, research into the company's current valuation metrics and future prospects seems fitting.
Ho Wah Genting Berhad does have some risks though, and we've spotted 3 warning signs for Ho Wah Genting Berhad that you might be interested in.
For those who like to invest in solid companies, check out this free list of companies with solid balance sheets and high returns on equity.
Have feedback on this article? Concerned about the content? Get in touch with us directly. Alternatively, email editorial-team (at) simplywallst.com.
This article by Simply Wall St is general in nature. We provide commentary based on historical data and analyst forecasts only using an unbiased methodology and our articles are not intended to be financial advice. It does not constitute a recommendation to buy or sell any stock, and does not take account of your objectives, or your financial situation. We aim to bring you long-term focused analysis driven by fundamental data. Note that our analysis may not factor in the latest price-sensitive company announcements or qualitative material. Simply Wall St has no position in any stocks mentioned.
Join A Paid User Research Session
You’ll receive a US$30 Amazon Gift card for 1 hour of your time while helping us build better investing tools for the individual investors like yourself. Sign up here
