
 Yahoo Finance
 Return Trends At Sage Group (LON:SGE) Aren't Appealing
There are a few key trends to look for if we want to identify the next multi-bagger. One common approach is to try and find a company with returns on capital employed (ROCE) that are increasing, in conjunction with a growing amount of capital employed. Basically this means that a company has profitable initiatives that it can continue to reinvest in, which is a trait of a compounding machine. Looking at Sage Group (LON:SGE), it does have a high ROCE right now, but lets see how returns are trending.
What is Return On Capital Employed (ROCE)?
Just to clarify if you're unsure, ROCE is a metric for evaluating how much pre-tax income (in percentage terms) a company earns on the capital invested in its business. The formula for this calculation on Sage Group is:
Return on Capital Employed = Earnings Before Interest and Tax (EBIT) ÷ (Total Assets - Current Liabilities)
0.23 = UK£453m ÷ (UK£3.3b - UK£1.4b) (Based on the trailing twelve months to September 2021).
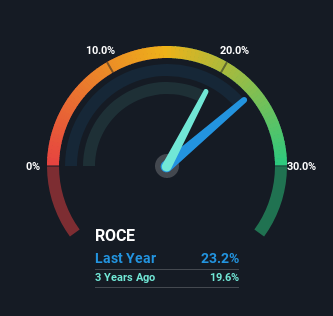
So, Sage Group has an ROCE of 23%. In absolute terms that's a great return and it's even better than the Software industry average of 8.3%.
View our latest analysis for Sage Group
Above you can see how the current ROCE for Sage Group compares to its prior returns on capital, but there's only so much you can tell from the past. If you'd like to see what analysts are forecasting going forward, you should check out our free report for Sage Group.
What Can We Tell From Sage Group's ROCE Trend?
Things have been pretty stable at Sage Group, with its capital employed and returns on that capital staying somewhat the same for the last five years. Businesses with these traits tend to be mature and steady operations because they're past the growth phase. So it may not be a multi-bagger in the making, but given the decent 23% return on capital, it'd be difficult to find fault with the business's current operations. This probably explains why Sage Group is paying out 59% of its income to shareholders in the form of dividends. Given the business isn't reinvesting in itself, it makes sense to distribute a portion of earnings among shareholders.
Another thing to note, Sage Group has a high ratio of current liabilities to total assets of 41%. This can bring about some risks because the company is basically operating with a rather large reliance on its suppliers or other sorts of short-term creditors. Ideally we'd like to see this reduce as that would mean fewer obligations bearing risks.
The Key Takeaway
In summary, Sage Group isn't compounding its earnings but is generating decent returns on the same amount of capital employed. Unsurprisingly, the stock has only gained 8.9% over the last five years, which potentially indicates that investors are accounting for this going forward. Therefore, if you're looking for a multi-bagger, we'd propose looking at other options.
Sage Group could be trading at an attractive price in other respects, so you might find our free intrinsic value estimation on our platform quite valuable.
If you'd like to see other companies earning high returns, check out our free list of companies earning high returns with solid balance sheets here.
Have feedback on this article? Concerned about the content? Get in touch with us directly. Alternatively, email editorial-team (at) simplywallst.com.
This article by Simply Wall St is general in nature. We provide commentary based on historical data and analyst forecasts only using an unbiased methodology and our articles are not intended to be financial advice. It does not constitute a recommendation to buy or sell any stock, and does not take account of your objectives, or your financial situation. We aim to bring you long-term focused analysis driven by fundamental data. Note that our analysis may not factor in the latest price-sensitive company announcements or qualitative material. Simply Wall St has no position in any stocks mentioned.
