
 Yahoo Finance
 The Return Trends At STS Group (ETR:SF3) Look Promising
Did you know there are some financial metrics that can provide clues of a potential multi-bagger? Firstly, we'd want to identify a growing return on capital employed (ROCE) and then alongside that, an ever-increasing base of capital employed. Basically this means that a company has profitable initiatives that it can continue to reinvest in, which is a trait of a compounding machine. Speaking of which, we noticed some great changes in STS Group's (ETR:SF3) returns on capital, so let's have a look.
Return On Capital Employed (ROCE): What Is It?
For those who don't know, ROCE is a measure of a company's yearly pre-tax profit (its return), relative to the capital employed in the business. The formula for this calculation on STS Group is:
Return on Capital Employed = Earnings Before Interest and Tax (EBIT) ÷ (Total Assets - Current Liabilities)
0.0049 = €500k ÷ (€231m - €130m) (Based on the trailing twelve months to June 2023).
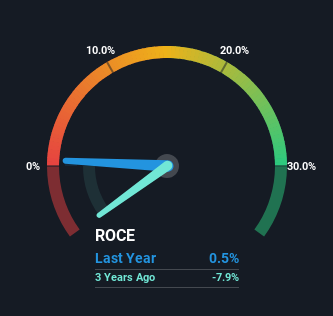
So, STS Group has an ROCE of 0.5%. Ultimately, that's a low return and it under-performs the Machinery industry average of 11%.
View our latest analysis for STS Group
In the above chart we have measured STS Group's prior ROCE against its prior performance, but the future is arguably more important. If you're interested, you can view the analysts predictions in our free analyst report for STS Group .
The Trend Of ROCE
It's great to see that STS Group has started to generate some pre-tax earnings from prior investments. While the business is profitable now, it used to be incurring losses on invested capital five years ago. At first glance, it seems the business is getting more proficient at generating returns, because over the same period, the amount of capital employed has reduced by 21%. The reduction could indicate that the company is selling some assets, and considering returns are up, they appear to be selling the right ones.
On a separate but related note, it's important to know that STS Group has a current liabilities to total assets ratio of 56%, which we'd consider pretty high. This can bring about some risks because the company is basically operating with a rather large reliance on its suppliers or other sorts of short-term creditors. Ideally we'd like to see this reduce as that would mean fewer obligations bearing risks.
The Bottom Line On STS Group's ROCE
In a nutshell, we're pleased to see that STS Group has been able to generate higher returns from less capital. Astute investors may have an opportunity here because the stock has declined 44% in the last five years. That being the case, research into the company's current valuation metrics and future prospects seems fitting.
If you want to continue researching STS Group, you might be interested to know about the 2 warning signs that our analysis has discovered.
While STS Group isn't earning the highest return, check out this free list of companies that are earning high returns on equity with solid balance sheets.
Have feedback on this article? Concerned about the content? Get in touch with us directly. Alternatively, email editorial-team (at) simplywallst.com.
This article by Simply Wall St is general in nature. We provide commentary based on historical data and analyst forecasts only using an unbiased methodology and our articles are not intended to be financial advice. It does not constitute a recommendation to buy or sell any stock, and does not take account of your objectives, or your financial situation. We aim to bring you long-term focused analysis driven by fundamental data. Note that our analysis may not factor in the latest price-sensitive company announcements or qualitative material. Simply Wall St has no position in any stocks mentioned.
