
 Yahoo Finance
 The Returns On Capital At AIREA (LON:AIEA) Don't Inspire Confidence
To find a multi-bagger stock, what are the underlying trends we should look for in a business? Firstly, we'd want to identify a growing return on capital employed (ROCE) and then alongside that, an ever-increasing base of capital employed. If you see this, it typically means it's a company with a great business model and plenty of profitable reinvestment opportunities. However, after briefly looking over the numbers, we don't think AIREA (LON:AIEA) has the makings of a multi-bagger going forward, but let's have a look at why that may be.
What Is Return On Capital Employed (ROCE)?
If you haven't worked with ROCE before, it measures the 'return' (pre-tax profit) a company generates from capital employed in its business. The formula for this calculation on AIREA is:
Return on Capital Employed = Earnings Before Interest and Tax (EBIT) ÷ (Total Assets - Current Liabilities)
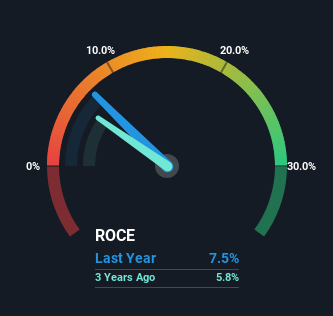
0.075 = UK£1.6m ÷ (UK£26m - UK£4.9m) (Based on the trailing twelve months to June 2023).
Therefore, AIREA has an ROCE of 7.5%. Ultimately, that's a low return and it under-performs the Consumer Durables industry average of 9.7%.
View our latest analysis for AIREA
While the past is not representative of the future, it can be helpful to know how a company has performed historically, which is why we have this chart above. If you're interested in investigating AIREA's past further, check out this free graph covering AIREA's past earnings, revenue and cash flow.
The Trend Of ROCE
In terms of AIREA's historical ROCE movements, the trend isn't fantastic. Around five years ago the returns on capital were 14%, but since then they've fallen to 7.5%. Although, given both revenue and the amount of assets employed in the business have increased, it could suggest the company is investing in growth, and the extra capital has led to a short-term reduction in ROCE. And if the increased capital generates additional returns, the business, and thus shareholders, will benefit in the long run.
The Bottom Line
Even though returns on capital have fallen in the short term, we find it promising that revenue and capital employed have both increased for AIREA. And there could be an opportunity here if other metrics look good too, because the stock has declined 55% in the last five years. So we think it'd be worthwhile to look further into this stock given the trends look encouraging.
AIREA does come with some risks though, we found 4 warning signs in our investment analysis, and 1 of those is concerning...
While AIREA isn't earning the highest return, check out this free list of companies that are earning high returns on equity with solid balance sheets.
Have feedback on this article? Concerned about the content? Get in touch with us directly. Alternatively, email editorial-team (at) simplywallst.com.
This article by Simply Wall St is general in nature. We provide commentary based on historical data and analyst forecasts only using an unbiased methodology and our articles are not intended to be financial advice. It does not constitute a recommendation to buy or sell any stock, and does not take account of your objectives, or your financial situation. We aim to bring you long-term focused analysis driven by fundamental data. Note that our analysis may not factor in the latest price-sensitive company announcements or qualitative material. Simply Wall St has no position in any stocks mentioned.
