
 Yahoo Finance
 Returns On Capital At Ascential (LON:ASCL) Paint A Concerning Picture
If we want to find a stock that could multiply over the long term, what are the underlying trends we should look for? One common approach is to try and find a company with returns on capital employed (ROCE) that are increasing, in conjunction with a growing amount of capital employed. This shows us that it's a compounding machine, able to continually reinvest its earnings back into the business and generate higher returns. However, after briefly looking over the numbers, we don't think Ascential (LON:ASCL) has the makings of a multi-bagger going forward, but let's have a look at why that may be.
Understanding Return On Capital Employed (ROCE)
For those that aren't sure what ROCE is, it measures the amount of pre-tax profits a company can generate from the capital employed in its business. Analysts use this formula to calculate it for Ascential:
Return on Capital Employed = Earnings Before Interest and Tax (EBIT) ÷ (Total Assets - Current Liabilities)
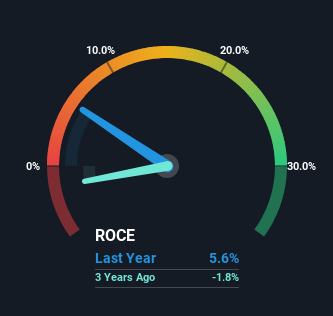
0.056 = UK£59m ÷ (UK£1.5b - UK£443m) (Based on the trailing twelve months to June 2023).
So, Ascential has an ROCE of 5.6%. Ultimately, that's a low return and it under-performs the Media industry average of 11%.
View our latest analysis for Ascential
In the above chart we have measured Ascential's prior ROCE against its prior performance, but the future is arguably more important. If you'd like, you can check out the forecasts from the analysts covering Ascential for free.
What Does the ROCE Trend For Ascential Tell Us?
In terms of Ascential's historical ROCE movements, the trend isn't fantastic. Around five years ago the returns on capital were 8.0%, but since then they've fallen to 5.6%. Although, given both revenue and the amount of assets employed in the business have increased, it could suggest the company is investing in growth, and the extra capital has led to a short-term reduction in ROCE. If these investments prove successful, this can bode very well for long term stock performance.
The Key Takeaway
In summary, despite lower returns in the short term, we're encouraged to see that Ascential is reinvesting for growth and has higher sales as a result. However, despite the promising trends, the stock has fallen 13% over the last five years, so there might be an opportunity here for astute investors. So we think it'd be worthwhile to look further into this stock given the trends look encouraging.
One more thing, we've spotted 1 warning sign facing Ascential that you might find interesting.
While Ascential isn't earning the highest return, check out this free list of companies that are earning high returns on equity with solid balance sheets.
Have feedback on this article? Concerned about the content? Get in touch with us directly. Alternatively, email editorial-team (at) simplywallst.com.
This article by Simply Wall St is general in nature. We provide commentary based on historical data and analyst forecasts only using an unbiased methodology and our articles are not intended to be financial advice. It does not constitute a recommendation to buy or sell any stock, and does not take account of your objectives, or your financial situation. We aim to bring you long-term focused analysis driven by fundamental data. Note that our analysis may not factor in the latest price-sensitive company announcements or qualitative material. Simply Wall St has no position in any stocks mentioned.
