
 Yahoo Finance
 The Returns On Capital At ASOS (LON:ASC) Don't Inspire Confidence
If we want to find a potential multi-bagger, often there are underlying trends that can provide clues. In a perfect world, we'd like to see a company investing more capital into its business and ideally the returns earned from that capital are also increasing. This shows us that it's a compounding machine, able to continually reinvest its earnings back into the business and generate higher returns. Having said that, from a first glance at ASOS (LON:ASC) we aren't jumping out of our chairs at how returns are trending, but let's have a deeper look.
Return On Capital Employed (ROCE): What is it?
For those who don't know, ROCE is a measure of a company's yearly pre-tax profit (its return), relative to the capital employed in the business. Analysts use this formula to calculate it for ASOS:
Return on Capital Employed = Earnings Before Interest and Tax (EBIT) ÷ (Total Assets - Current Liabilities)
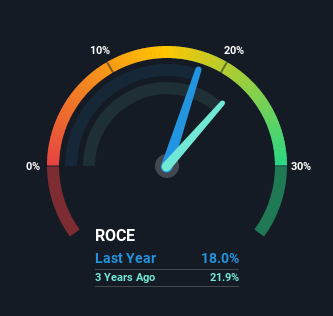
0.18 = UK£228m ÷ (UK£2.2b - UK£914m) (Based on the trailing twelve months to February 2021).
So, ASOS has an ROCE of 18%. That's a pretty standard return and it's in line with the industry average of 18%.
See our latest analysis for ASOS
Above you can see how the current ROCE for ASOS compares to its prior returns on capital, but there's only so much you can tell from the past. If you'd like to see what analysts are forecasting going forward, you should check out our free report for ASOS.
What Can We Tell From ASOS' ROCE Trend?
Unfortunately, the trend isn't great with ROCE falling from 27% five years ago, while capital employed has grown 449%. However, some of the increase in capital employed could be attributed to the recent capital raising that's been completed prior to their latest reporting period, so keep that in mind when looking at the ROCE decrease. It's unlikely that all of the funds raised have been put to work yet, so as a consequence ASOS might not have received a full period of earnings contribution from it.
On a side note, ASOS has done well to pay down its current liabilities to 42% of total assets. That could partly explain why the ROCE has dropped. What's more, this can reduce some aspects of risk to the business because now the company's suppliers or short-term creditors are funding less of its operations. Some would claim this reduces the business' efficiency at generating ROCE since it is now funding more of the operations with its own money. Either way, they're still at a pretty high level, so we'd like to see them fall further if possible.
The Bottom Line On ASOS' ROCE
While returns have fallen for ASOS in recent times, we're encouraged to see that sales are growing and that the business is reinvesting in its operations. These growth trends haven't led to growth returns though, since the stock has fallen 13% over the last five years. As a result, we'd recommend researching this stock further to uncover what other fundamentals of the business can show us.
If you want to continue researching ASOS, you might be interested to know about the 2 warning signs that our analysis has discovered.
If you want to search for solid companies with great earnings, check out this free list of companies with good balance sheets and impressive returns on equity.
This article by Simply Wall St is general in nature. It does not constitute a recommendation to buy or sell any stock, and does not take account of your objectives, or your financial situation. We aim to bring you long-term focused analysis driven by fundamental data. Note that our analysis may not factor in the latest price-sensitive company announcements or qualitative material. Simply Wall St has no position in any stocks mentioned.
Have feedback on this article? Concerned about the content? Get in touch with us directly. Alternatively, email editorial-team (at) simplywallst.com.
