
 Yahoo Finance
 Returns On Capital At Camping World Holdings (NYSE:CWH) Paint A Concerning Picture
To find a multi-bagger stock, what are the underlying trends we should look for in a business? Amongst other things, we'll want to see two things; firstly, a growing return on capital employed (ROCE) and secondly, an expansion in the company's amount of capital employed. Basically this means that a company has profitable initiatives that it can continue to reinvest in, which is a trait of a compounding machine. So when we looked at Camping World Holdings (NYSE:CWH), they do have a high ROCE, but we weren't exactly elated from how returns are trending.
Return On Capital Employed (ROCE): What is it?
For those who don't know, ROCE is a measure of a company's yearly pre-tax profit (its return), relative to the capital employed in the business. Analysts use this formula to calculate it for Camping World Holdings:
Return on Capital Employed = Earnings Before Interest and Tax (EBIT) ÷ (Total Assets - Current Liabilities)
0.33 = US$834m ÷ (US$3.8b - US$1.2b) (Based on the trailing twelve months to September 2021).
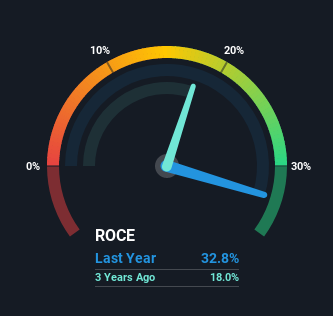
So, Camping World Holdings has an ROCE of 33%. That's a fantastic return and not only that, it outpaces the average of 21% earned by companies in a similar industry.
See our latest analysis for Camping World Holdings
In the above chart we have measured Camping World Holdings' prior ROCE against its prior performance, but the future is arguably more important. If you'd like, you can check out the forecasts from the analysts covering Camping World Holdings here for free.
What Can We Tell From Camping World Holdings' ROCE Trend?
When we looked at the ROCE trend at Camping World Holdings, we didn't gain much confidence. While it's comforting that the ROCE is high, five years ago it was 53%. Although, given both revenue and the amount of assets employed in the business have increased, it could suggest the company is investing in growth, and the extra capital has led to a short-term reduction in ROCE. If these investments prove successful, this can bode very well for long term stock performance.
On a side note, Camping World Holdings has done well to pay down its current liabilities to 33% of total assets. That could partly explain why the ROCE has dropped. Effectively this means their suppliers or short-term creditors are funding less of the business, which reduces some elements of risk. Some would claim this reduces the business' efficiency at generating ROCE since it is now funding more of the operations with its own money.
The Bottom Line On Camping World Holdings' ROCE
Even though returns on capital have fallen in the short term, we find it promising that revenue and capital employed have both increased for Camping World Holdings. These trends are starting to be recognized by investors since the stock has delivered a 19% gain to shareholders who've held over the last five years. So this stock may still be an appealing investment opportunity, if other fundamentals prove to be sound.
If you'd like to know about the risks facing Camping World Holdings, we've discovered 3 warning signs that you should be aware of.
If you'd like to see other companies earning high returns, check out our free list of companies earning high returns with solid balance sheets here.
Have feedback on this article? Concerned about the content? Get in touch with us directly. Alternatively, email editorial-team (at) simplywallst.com.
This article by Simply Wall St is general in nature. We provide commentary based on historical data and analyst forecasts only using an unbiased methodology and our articles are not intended to be financial advice. It does not constitute a recommendation to buy or sell any stock, and does not take account of your objectives, or your financial situation. We aim to bring you long-term focused analysis driven by fundamental data. Note that our analysis may not factor in the latest price-sensitive company announcements or qualitative material. Simply Wall St has no position in any stocks mentioned.
