
 Yahoo Finance
 Returns On Capital At Canadian Utilities (TSE:CU) Have Hit The Brakes
If we want to find a stock that could multiply over the long term, what are the underlying trends we should look for? Amongst other things, we'll want to see two things; firstly, a growing return on capital employed (ROCE) and secondly, an expansion in the company's amount of capital employed. Basically this means that a company has profitable initiatives that it can continue to reinvest in, which is a trait of a compounding machine. In light of that, when we looked at Canadian Utilities (TSE:CU) and its ROCE trend, we weren't exactly thrilled.
Return On Capital Employed (ROCE): What Is It?
Just to clarify if you're unsure, ROCE is a metric for evaluating how much pre-tax income (in percentage terms) a company earns on the capital invested in its business. To calculate this metric for Canadian Utilities, this is the formula:
Return on Capital Employed = Earnings Before Interest and Tax (EBIT) ÷ (Total Assets - Current Liabilities)
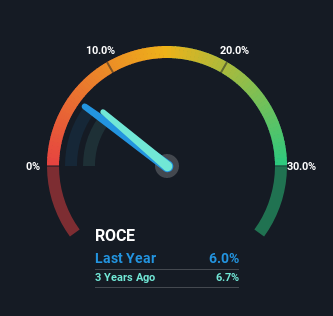
0.06 = CA$1.2b ÷ (CA$22b - CA$1.2b) (Based on the trailing twelve months to September 2022).
So, Canadian Utilities has an ROCE of 6.0%. In absolute terms, that's a low return, but it's much better than the Integrated Utilities industry average of 4.7%.
See our latest analysis for Canadian Utilities
In the above chart we have measured Canadian Utilities' prior ROCE against its prior performance, but the future is arguably more important. If you're interested, you can view the analysts predictions in our free report on analyst forecasts for the company.
What Can We Tell From Canadian Utilities' ROCE Trend?
There hasn't been much to report for Canadian Utilities' returns and its level of capital employed because both metrics have been steady for the past five years. Businesses with these traits tend to be mature and steady operations because they're past the growth phase. So unless we see a substantial change at Canadian Utilities in terms of ROCE and additional investments being made, we wouldn't hold our breath on it being a multi-bagger. On top of that you'll notice that Canadian Utilities has been paying out a large portion (79%) of earnings in the form of dividends to shareholders. If the company is in fact lacking growth opportunities, that's one of the viable alternatives for the money.
In Conclusion...
In a nutshell, Canadian Utilities has been trudging along with the same returns from the same amount of capital over the last five years. Unsurprisingly, the stock has only gained 16% over the last five years, which potentially indicates that investors are accounting for this going forward. So if you're looking for a multi-bagger, the underlying trends indicate you may have better chances elsewhere.
Canadian Utilities does come with some risks though, we found 2 warning signs in our investment analysis, and 1 of those makes us a bit uncomfortable...
If you want to search for solid companies with great earnings, check out this free list of companies with good balance sheets and impressive returns on equity.
Have feedback on this article? Concerned about the content? Get in touch with us directly. Alternatively, email editorial-team (at) simplywallst.com.
This article by Simply Wall St is general in nature. We provide commentary based on historical data and analyst forecasts only using an unbiased methodology and our articles are not intended to be financial advice. It does not constitute a recommendation to buy or sell any stock, and does not take account of your objectives, or your financial situation. We aim to bring you long-term focused analysis driven by fundamental data. Note that our analysis may not factor in the latest price-sensitive company announcements or qualitative material. Simply Wall St has no position in any stocks mentioned.
Join A Paid User Research Session
You’ll receive a US$30 Amazon Gift card for 1 hour of your time while helping us build better investing tools for the individual investors like yourself. Sign up here
