
 Yahoo Finance
 The Returns On Capital At Ceragon Networks (NASDAQ:CRNT) Don't Inspire Confidence
If we want to find a potential multi-bagger, often there are underlying trends that can provide clues. Amongst other things, we'll want to see two things; firstly, a growing return on capital employed (ROCE) and secondly, an expansion in the company's amount of capital employed. Basically this means that a company has profitable initiatives that it can continue to reinvest in, which is a trait of a compounding machine. Having said that, from a first glance at Ceragon Networks (NASDAQ:CRNT) we aren't jumping out of our chairs at how returns are trending, but let's have a deeper look.
Understanding Return On Capital Employed (ROCE)
If you haven't worked with ROCE before, it measures the 'return' (pre-tax profit) a company generates from capital employed in its business. Analysts use this formula to calculate it for Ceragon Networks:
Return on Capital Employed = Earnings Before Interest and Tax (EBIT) ÷ (Total Assets - Current Liabilities)
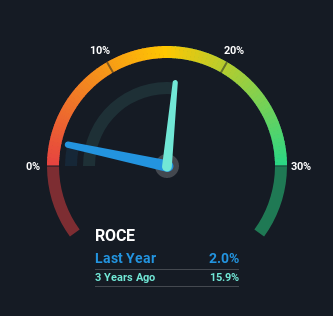
0.02 = US$3.8m ÷ (US$295m - US$107m) (Based on the trailing twelve months to September 2021).
Therefore, Ceragon Networks has an ROCE of 2.0%. In absolute terms, that's a low return and it also under-performs the Communications industry average of 8.6%.
Check out our latest analysis for Ceragon Networks
In the above chart we have measured Ceragon Networks' prior ROCE against its prior performance, but the future is arguably more important. If you'd like, you can check out the forecasts from the analysts covering Ceragon Networks here for free.
What Can We Tell From Ceragon Networks' ROCE Trend?
When we looked at the ROCE trend at Ceragon Networks, we didn't gain much confidence. Over the last five years, returns on capital have decreased to 2.0% from 12% five years ago. Although, given both revenue and the amount of assets employed in the business have increased, it could suggest the company is investing in growth, and the extra capital has led to a short-term reduction in ROCE. And if the increased capital generates additional returns, the business, and thus shareholders, will benefit in the long run.
On a related note, Ceragon Networks has decreased its current liabilities to 36% of total assets. That could partly explain why the ROCE has dropped. What's more, this can reduce some aspects of risk to the business because now the company's suppliers or short-term creditors are funding less of its operations. Some would claim this reduces the business' efficiency at generating ROCE since it is now funding more of the operations with its own money.
What We Can Learn From Ceragon Networks' ROCE
In summary, despite lower returns in the short term, we're encouraged to see that Ceragon Networks is reinvesting for growth and has higher sales as a result. In light of this, the stock has only gained 13% over the last five years. So this stock may still be an appealing investment opportunity, if other fundamentals prove to be sound.
If you want to continue researching Ceragon Networks, you might be interested to know about the 2 warning signs that our analysis has discovered.
While Ceragon Networks may not currently earn the highest returns, we've compiled a list of companies that currently earn more than 25% return on equity. Check out this free list here.
Have feedback on this article? Concerned about the content? Get in touch with us directly. Alternatively, email editorial-team (at) simplywallst.com.
This article by Simply Wall St is general in nature. We provide commentary based on historical data and analyst forecasts only using an unbiased methodology and our articles are not intended to be financial advice. It does not constitute a recommendation to buy or sell any stock, and does not take account of your objectives, or your financial situation. We aim to bring you long-term focused analysis driven by fundamental data. Note that our analysis may not factor in the latest price-sensitive company announcements or qualitative material. Simply Wall St has no position in any stocks mentioned.
