
 Yahoo Finance
 Our Take On The Returns On Capital At Christie Group (LON:CTG)

If we want to find a stock that could multiply over the long term, what are the underlying trends we should look for? Firstly, we'd want to identify a growing return on capital employed (ROCE) and then alongside that, an ever-increasing base of capital employed. This shows us that it's a compounding machine, able to continually reinvest its earnings back into the business and generate higher returns. However, after investigating Christie Group (LON:CTG), we don't think it's current trends fit the mold of a multi-bagger.
Understanding Return On Capital Employed (ROCE)
For those who don't know, ROCE is a measure of a company's yearly pre-tax profit (its return), relative to the capital employed in the business. To calculate this metric for Christie Group, this is the formula:
Return on Capital Employed = Earnings Before Interest and Tax (EBIT) ÷ (Total Assets - Current Liabilities)
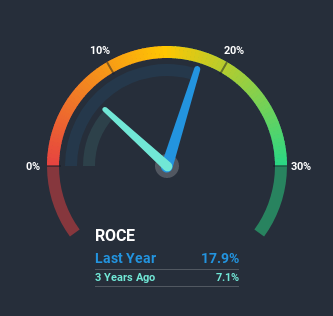
0.18 = UK£3.9m ÷ (UK£41m - UK£19m) (Based on the trailing twelve months to December 2019).
Therefore, Christie Group has an ROCE of 18%. On its own, that's a standard return, however it's much better than the 13% generated by the Professional Services industry.
View our latest analysis for Christie Group
While the past is not representative of the future, it can be helpful to know how a company has performed historically, which is why we have this chart above. If you want to delve into the historical earnings, revenue and cash flow of Christie Group, check out these free graphs here.
What Can We Tell From Christie Group's ROCE Trend?
When we looked at the ROCE trend at Christie Group, we didn't gain much confidence. Over the last five years, returns on capital have decreased to 18% from 46% five years ago. Meanwhile, the business is utilizing more capital but this hasn't moved the needle much in terms of sales in the past 12 months, so this could reflect longer term investments. It's worth keeping an eye on the company's earnings from here on to see if these investments do end up contributing to the bottom line.
On a related note, Christie Group has decreased its current liabilities to 47% of total assets. So we could link some of this to the decrease in ROCE. Effectively this means their suppliers or short-term creditors are funding less of the business, which reduces some elements of risk. Since the business is basically funding more of its operations with it's own money, you could argue this has made the business less efficient at generating ROCE. Either way, they're still at a pretty high level, so we'd like to see them fall further if possible.
The Bottom Line
In summary, Christie Group is reinvesting funds back into the business for growth but unfortunately it looks like sales haven't increased much just yet. And investors appear hesitant that the trends will pick up because the stock has fallen 34% in the last five years. Therefore based on the analysis done in this article, we don't think Christie Group has the makings of a multi-bagger.
Christie Group does have some risks though, and we've spotted 3 warning signs for Christie Group that you might be interested in.
For those who like to invest in solid companies, check out this free list of companies with solid balance sheets and high returns on equity.
This article by Simply Wall St is general in nature. It does not constitute a recommendation to buy or sell any stock, and does not take account of your objectives, or your financial situation. We aim to bring you long-term focused analysis driven by fundamental data. Note that our analysis may not factor in the latest price-sensitive company announcements or qualitative material. Simply Wall St has no position in any stocks mentioned.
Have feedback on this article? Concerned about the content? Get in touch with us directly. Alternatively, email editorial-team@simplywallst.com.
