
 Yahoo Finance
 The Returns On Capital At Crimson Tide (LON:TIDE) Don't Inspire Confidence
To find a multi-bagger stock, what are the underlying trends we should look for in a business? Firstly, we'd want to identify a growing return on capital employed (ROCE) and then alongside that, an ever-increasing base of capital employed. Basically this means that a company has profitable initiatives that it can continue to reinvest in, which is a trait of a compounding machine. Although, when we looked at Crimson Tide (LON:TIDE), it didn't seem to tick all of these boxes.
Return On Capital Employed (ROCE): What is it?
For those who don't know, ROCE is a measure of a company's yearly pre-tax profit (its return), relative to the capital employed in the business. To calculate this metric for Crimson Tide, this is the formula:
Return on Capital Employed = Earnings Before Interest and Tax (EBIT) ÷ (Total Assets - Current Liabilities)
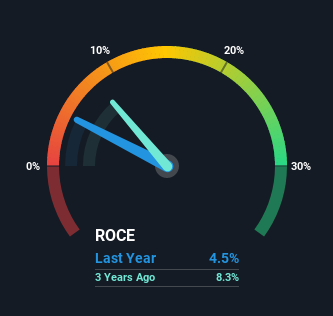
0.045 = UK£455k ÷ (UK£11m - UK£882k) (Based on the trailing twelve months to June 2021).
Therefore, Crimson Tide has an ROCE of 4.5%. In absolute terms, that's a low return and it also under-performs the Software industry average of 8.6%.
See our latest analysis for Crimson Tide
In the above chart we have measured Crimson Tide's prior ROCE against its prior performance, but the future is arguably more important. If you'd like to see what analysts are forecasting going forward, you should check out our free report for Crimson Tide.
The Trend Of ROCE
On the surface, the trend of ROCE at Crimson Tide doesn't inspire confidence. Around five years ago the returns on capital were 11%, but since then they've fallen to 4.5%. Although, given both revenue and the amount of assets employed in the business have increased, it could suggest the company is investing in growth, and the extra capital has led to a short-term reduction in ROCE. And if the increased capital generates additional returns, the business, and thus shareholders, will benefit in the long run.
On a related note, Crimson Tide has decreased its current liabilities to 8.1% of total assets. So we could link some of this to the decrease in ROCE. Effectively this means their suppliers or short-term creditors are funding less of the business, which reduces some elements of risk. Some would claim this reduces the business' efficiency at generating ROCE since it is now funding more of the operations with its own money.
What We Can Learn From Crimson Tide's ROCE
Even though returns on capital have fallen in the short term, we find it promising that revenue and capital employed have both increased for Crimson Tide. However, total returns to shareholders over the last five years have been flat, which could indicate these growth trends potentially aren't accounted for yet by investors. So we think it'd be worthwhile to look further into this stock given the trends look encouraging.
One final note, you should learn about the 4 warning signs we've spotted with Crimson Tide (including 2 which are a bit unpleasant) .
While Crimson Tide may not currently earn the highest returns, we've compiled a list of companies that currently earn more than 25% return on equity. Check out this free list here.
This article by Simply Wall St is general in nature. We provide commentary based on historical data and analyst forecasts only using an unbiased methodology and our articles are not intended to be financial advice. It does not constitute a recommendation to buy or sell any stock, and does not take account of your objectives, or your financial situation. We aim to bring you long-term focused analysis driven by fundamental data. Note that our analysis may not factor in the latest price-sensitive company announcements or qualitative material. Simply Wall St has no position in any stocks mentioned.
Have feedback on this article? Concerned about the content? Get in touch with us directly. Alternatively, email editorial-team (at) simplywallst.com.
