
 Yahoo Finance
 Returns On Capital At EITA Resources Berhad (KLSE:EITA) Paint A Concerning Picture
If we want to find a potential multi-bagger, often there are underlying trends that can provide clues. Ideally, a business will show two trends; firstly a growing return on capital employed (ROCE) and secondly, an increasing amount of capital employed. This shows us that it's a compounding machine, able to continually reinvest its earnings back into the business and generate higher returns. Having said that, from a first glance at EITA Resources Berhad (KLSE:EITA) we aren't jumping out of our chairs at how returns are trending, but let's have a deeper look.
Return On Capital Employed (ROCE): What Is It?
Just to clarify if you're unsure, ROCE is a metric for evaluating how much pre-tax income (in percentage terms) a company earns on the capital invested in its business. To calculate this metric for EITA Resources Berhad, this is the formula:
Return on Capital Employed = Earnings Before Interest and Tax (EBIT) ÷ (Total Assets - Current Liabilities)
0.10 = RM27m ÷ (RM379m - RM117m) (Based on the trailing twelve months to March 2024).
So, EITA Resources Berhad has an ROCE of 10%. On its own, that's a standard return, however it's much better than the 7.6% generated by the Machinery industry.
View our latest analysis for EITA Resources Berhad
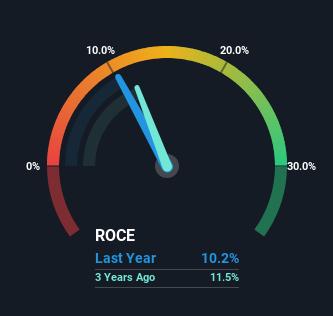
Historical performance is a great place to start when researching a stock so above you can see the gauge for EITA Resources Berhad's ROCE against it's prior returns. If you'd like to look at how EITA Resources Berhad has performed in the past in other metrics, you can view this free graph of EITA Resources Berhad's past earnings, revenue and cash flow.
How Are Returns Trending?
In terms of EITA Resources Berhad's historical ROCE movements, the trend isn't fantastic. Over the last five years, returns on capital have decreased to 10% from 13% five years ago. However, given capital employed and revenue have both increased it appears that the business is currently pursuing growth, at the consequence of short term returns. And if the increased capital generates additional returns, the business, and thus shareholders, will benefit in the long run.
What We Can Learn From EITA Resources Berhad's ROCE
While returns have fallen for EITA Resources Berhad in recent times, we're encouraged to see that sales are growing and that the business is reinvesting in its operations. And the stock has followed suit returning a meaningful 48% to shareholders over the last five years. So while the underlying trends could already be accounted for by investors, we still think this stock is worth looking into further.
EITA Resources Berhad does come with some risks though, we found 4 warning signs in our investment analysis, and 1 of those shouldn't be ignored...
For those who like to invest in solid companies, check out this free list of companies with solid balance sheets and high returns on equity.
Have feedback on this article? Concerned about the content? Get in touch with us directly. Alternatively, email editorial-team (at) simplywallst.com.
This article by Simply Wall St is general in nature. We provide commentary based on historical data and analyst forecasts only using an unbiased methodology and our articles are not intended to be financial advice. It does not constitute a recommendation to buy or sell any stock, and does not take account of your objectives, or your financial situation. We aim to bring you long-term focused analysis driven by fundamental data. Note that our analysis may not factor in the latest price-sensitive company announcements or qualitative material. Simply Wall St has no position in any stocks mentioned.
Have feedback on this article? Concerned about the content? Get in touch with us directly. Alternatively, email editorial-team@simplywallst.com
