
 Yahoo Finance
 Returns On Capital At Flowtech Fluidpower (LON:FLO) Paint A Concerning Picture
What financial metrics can indicate to us that a company is maturing or even in decline? Typically, we'll see the trend of both return on capital employed (ROCE) declining and this usually coincides with a decreasing amount of capital employed. This reveals that the company isn't compounding shareholder wealth because returns are falling and its net asset base is shrinking. So after glancing at the trends within Flowtech Fluidpower (LON:FLO), we weren't too hopeful.
What Is Return On Capital Employed (ROCE)?
Just to clarify if you're unsure, ROCE is a metric for evaluating how much pre-tax income (in percentage terms) a company earns on the capital invested in its business. Analysts use this formula to calculate it for Flowtech Fluidpower:
Return on Capital Employed = Earnings Before Interest and Tax (EBIT) ÷ (Total Assets - Current Liabilities)
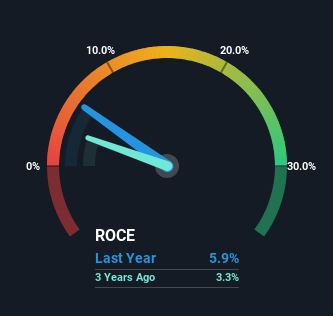
0.059 = UK£6.4m ÷ (UK£132m - UK£23m) (Based on the trailing twelve months to June 2023).
Therefore, Flowtech Fluidpower has an ROCE of 5.9%. In absolute terms, that's a low return and it also under-performs the Trade Distributors industry average of 15%.
See our latest analysis for Flowtech Fluidpower
In the above chart we have measured Flowtech Fluidpower's prior ROCE against its prior performance, but the future is arguably more important. If you'd like to see what analysts are forecasting going forward, you should check out our free analyst report for Flowtech Fluidpower .
What Can We Tell From Flowtech Fluidpower's ROCE Trend?
We are a bit worried about the trend of returns on capital at Flowtech Fluidpower. About five years ago, returns on capital were 9.3%, however they're now substantially lower than that as we saw above. Meanwhile, capital employed in the business has stayed roughly the flat over the period. This combination can be indicative of a mature business that still has areas to deploy capital, but the returns received aren't as high due potentially to new competition or smaller margins. If these trends continue, we wouldn't expect Flowtech Fluidpower to turn into a multi-bagger.
On a side note, Flowtech Fluidpower has done well to pay down its current liabilities to 17% of total assets. So we could link some of this to the decrease in ROCE. Effectively this means their suppliers or short-term creditors are funding less of the business, which reduces some elements of risk. Some would claim this reduces the business' efficiency at generating ROCE since it is now funding more of the operations with its own money.
What We Can Learn From Flowtech Fluidpower's ROCE
In summary, it's unfortunate that Flowtech Fluidpower is generating lower returns from the same amount of capital. Investors haven't taken kindly to these developments, since the stock has declined 20% from where it was five years ago. That being the case, unless the underlying trends revert to a more positive trajectory, we'd consider looking elsewhere.
One more thing: We've identified 4 warning signs with Flowtech Fluidpower (at least 1 which is potentially serious) , and understanding them would certainly be useful.
While Flowtech Fluidpower isn't earning the highest return, check out this free list of companies that are earning high returns on equity with solid balance sheets.
Have feedback on this article? Concerned about the content? Get in touch with us directly. Alternatively, email editorial-team (at) simplywallst.com.
This article by Simply Wall St is general in nature. We provide commentary based on historical data and analyst forecasts only using an unbiased methodology and our articles are not intended to be financial advice. It does not constitute a recommendation to buy or sell any stock, and does not take account of your objectives, or your financial situation. We aim to bring you long-term focused analysis driven by fundamental data. Note that our analysis may not factor in the latest price-sensitive company announcements or qualitative material. Simply Wall St has no position in any stocks mentioned.
