
 Yahoo Finance
 Returns On Capital At Gulf Marine Services (LON:GMS) Have Stalled
If we want to find a stock that could multiply over the long term, what are the underlying trends we should look for? Amongst other things, we'll want to see two things; firstly, a growing return on capital employed (ROCE) and secondly, an expansion in the company's amount of capital employed. Put simply, these types of businesses are compounding machines, meaning they are continually reinvesting their earnings at ever-higher rates of return. Although, when we looked at Gulf Marine Services (LON:GMS), it didn't seem to tick all of these boxes.
What Is Return On Capital Employed (ROCE)?
Just to clarify if you're unsure, ROCE is a metric for evaluating how much pre-tax income (in percentage terms) a company earns on the capital invested in its business. To calculate this metric for Gulf Marine Services, this is the formula:
Return on Capital Employed = Earnings Before Interest and Tax (EBIT) ÷ (Total Assets - Current Liabilities)
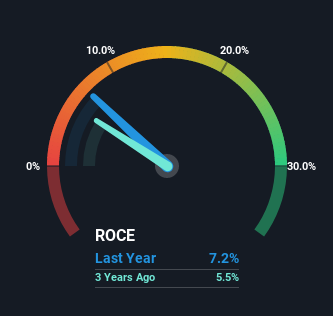
0.072 = US$43m ÷ (US$661m - US$59m) (Based on the trailing twelve months to June 2022).
Thus, Gulf Marine Services has an ROCE of 7.2%. Even though it's in line with the industry average of 7.4%, it's still a low return by itself.
View our latest analysis for Gulf Marine Services
In the above chart we have measured Gulf Marine Services' prior ROCE against its prior performance, but the future is arguably more important. If you're interested, you can view the analysts predictions in our free report on analyst forecasts for the company.
The Trend Of ROCE
In terms of Gulf Marine Services' historical ROCE trend, it doesn't exactly demand attention. The company has consistently earned 7.2% for the last five years, and the capital employed within the business has risen 36% in that time. Given the company has increased the amount of capital employed, it appears the investments that have been made simply don't provide a high return on capital.
One more thing to note, even though ROCE has remained relatively flat over the last five years, the reduction in current liabilities to 9.0% of total assets, is good to see from a business owner's perspective. This can eliminate some of the risks inherent in the operations because the business has less outstanding obligations to their suppliers and or short-term creditors than they did previously.
In Conclusion...
In summary, Gulf Marine Services has simply been reinvesting capital and generating the same low rate of return as before. Moreover, since the stock has crumbled 87% over the last five years, it appears investors are expecting the worst. All in all, the inherent trends aren't typical of multi-baggers, so if that's what you're after, we think you might have more luck elsewhere.
On a final note, we found 4 warning signs for Gulf Marine Services (2 don't sit too well with us) you should be aware of.
If you want to search for solid companies with great earnings, check out this free list of companies with good balance sheets and impressive returns on equity.
Have feedback on this article? Concerned about the content? Get in touch with us directly. Alternatively, email editorial-team (at) simplywallst.com.
This article by Simply Wall St is general in nature. We provide commentary based on historical data and analyst forecasts only using an unbiased methodology and our articles are not intended to be financial advice. It does not constitute a recommendation to buy or sell any stock, and does not take account of your objectives, or your financial situation. We aim to bring you long-term focused analysis driven by fundamental data. Note that our analysis may not factor in the latest price-sensitive company announcements or qualitative material. Simply Wall St has no position in any stocks mentioned.
Join A Paid User Research Session
You’ll receive a US$30 Amazon Gift card for 1 hour of your time while helping us build better investing tools for the individual investors like yourself. Sign up here
