
 Yahoo Finance
 Returns On Capital At Hain Celestial Group (NASDAQ:HAIN) Have Stalled
If we want to find a stock that could multiply over the long term, what are the underlying trends we should look for? Firstly, we'll want to see a proven return on capital employed (ROCE) that is increasing, and secondly, an expanding base of capital employed. If you see this, it typically means it's a company with a great business model and plenty of profitable reinvestment opportunities. However, after briefly looking over the numbers, we don't think Hain Celestial Group (NASDAQ:HAIN) has the makings of a multi-bagger going forward, but let's have a look at why that may be.
Understanding Return On Capital Employed (ROCE)
Just to clarify if you're unsure, ROCE is a metric for evaluating how much pre-tax income (in percentage terms) a company earns on the capital invested in its business. To calculate this metric for Hain Celestial Group, this is the formula:
Return on Capital Employed = Earnings Before Interest and Tax (EBIT) ÷ (Total Assets - Current Liabilities)
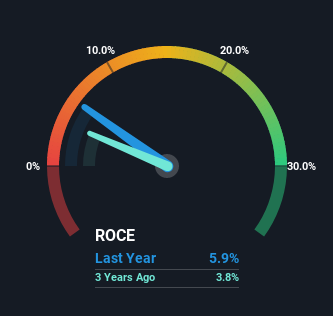
0.059 = US$130m ÷ (US$2.5b - US$269m) (Based on the trailing twelve months to June 2022).
Therefore, Hain Celestial Group has an ROCE of 5.9%. Ultimately, that's a low return and it under-performs the Food industry average of 9.6%.
Check out our latest analysis for Hain Celestial Group
Above you can see how the current ROCE for Hain Celestial Group compares to its prior returns on capital, but there's only so much you can tell from the past. If you're interested, you can view the analysts predictions in our free report on analyst forecasts for the company.
How Are Returns Trending?
Things have been pretty stable at Hain Celestial Group, with its capital employed and returns on that capital staying somewhat the same for the last five years. This tells us the company isn't reinvesting in itself, so it's plausible that it's past the growth phase. So don't be surprised if Hain Celestial Group doesn't end up being a multi-bagger in a few years time.
The Key Takeaway
In a nutshell, Hain Celestial Group has been trudging along with the same returns from the same amount of capital over the last five years. And investors appear hesitant that the trends will pick up because the stock has fallen 57% in the last five years. All in all, the inherent trends aren't typical of multi-baggers, so if that's what you're after, we think you might have more luck elsewhere.
One more thing, we've spotted 1 warning sign facing Hain Celestial Group that you might find interesting.
If you want to search for solid companies with great earnings, check out this free list of companies with good balance sheets and impressive returns on equity.
Have feedback on this article? Concerned about the content? Get in touch with us directly. Alternatively, email editorial-team (at) simplywallst.com.
This article by Simply Wall St is general in nature. We provide commentary based on historical data and analyst forecasts only using an unbiased methodology and our articles are not intended to be financial advice. It does not constitute a recommendation to buy or sell any stock, and does not take account of your objectives, or your financial situation. We aim to bring you long-term focused analysis driven by fundamental data. Note that our analysis may not factor in the latest price-sensitive company announcements or qualitative material. Simply Wall St has no position in any stocks mentioned.
Join A Paid User Research Session
You’ll receive a US$30 Amazon Gift card for 1 hour of your time while helping us build better investing tools for the individual investors like yourself. Sign up here
