
 Yahoo Finance
 Returns On Capital At Howden Joinery Group (LON:HWDN) Paint A Concerning Picture
There are a few key trends to look for if we want to identify the next multi-bagger. Firstly, we'd want to identify a growing return on capital employed (ROCE) and then alongside that, an ever-increasing base of capital employed. This shows us that it's a compounding machine, able to continually reinvest its earnings back into the business and generate higher returns. So when we looked at Howden Joinery Group (LON:HWDN), they do have a high ROCE, but we weren't exactly elated from how returns are trending.
Understanding Return On Capital Employed (ROCE)
Just to clarify if you're unsure, ROCE is a metric for evaluating how much pre-tax income (in percentage terms) a company earns on the capital invested in its business. To calculate this metric for Howden Joinery Group, this is the formula:
Return on Capital Employed = Earnings Before Interest and Tax (EBIT) ÷ (Total Assets - Current Liabilities)
0.21 = UK£339m ÷ (UK£2.1b - UK£468m) (Based on the trailing twelve months to December 2023).
Thus, Howden Joinery Group has an ROCE of 21%. That's a fantastic return and not only that, it outpaces the average of 15% earned by companies in a similar industry.
See our latest analysis for Howden Joinery Group
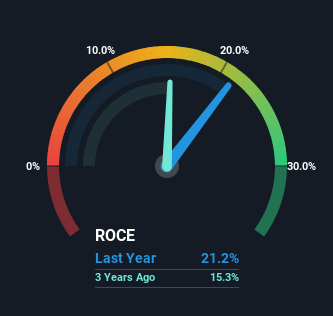
Above you can see how the current ROCE for Howden Joinery Group compares to its prior returns on capital, but there's only so much you can tell from the past. If you'd like to see what analysts are forecasting going forward, you should check out our free analyst report for Howden Joinery Group .
How Are Returns Trending?
On the surface, the trend of ROCE at Howden Joinery Group doesn't inspire confidence. While it's comforting that the ROCE is high, five years ago it was 39%. On the other hand, the company has been employing more capital without a corresponding improvement in sales in the last year, which could suggest these investments are longer term plays. It may take some time before the company starts to see any change in earnings from these investments.
The Key Takeaway
In summary, Howden Joinery Group is reinvesting funds back into the business for growth but unfortunately it looks like sales haven't increased much just yet. Although the market must be expecting these trends to improve because the stock has gained 92% over the last five years. Ultimately, if the underlying trends persist, we wouldn't hold our breath on it being a multi-bagger going forward.
On a final note, we've found 2 warning signs for Howden Joinery Group that we think you should be aware of.
Howden Joinery Group is not the only stock earning high returns. If you'd like to see more, check out our free list of companies earning high returns on equity with solid fundamentals.
Have feedback on this article? Concerned about the content? Get in touch with us directly. Alternatively, email editorial-team (at) simplywallst.com.
This article by Simply Wall St is general in nature. We provide commentary based on historical data and analyst forecasts only using an unbiased methodology and our articles are not intended to be financial advice. It does not constitute a recommendation to buy or sell any stock, and does not take account of your objectives, or your financial situation. We aim to bring you long-term focused analysis driven by fundamental data. Note that our analysis may not factor in the latest price-sensitive company announcements or qualitative material. Simply Wall St has no position in any stocks mentioned.
