
 Yahoo Finance
 Returns On Capital At Integrated Diagnostics Holdings (LON:IDHC) Paint A Concerning Picture
Finding a business that has the potential to grow substantially is not easy, but it is possible if we look at a few key financial metrics. Firstly, we'd want to identify a growing return on capital employed (ROCE) and then alongside that, an ever-increasing base of capital employed. Put simply, these types of businesses are compounding machines, meaning they are continually reinvesting their earnings at ever-higher rates of return. However, after briefly looking over the numbers, we don't think Integrated Diagnostics Holdings (LON:IDHC) has the makings of a multi-bagger going forward, but let's have a look at why that may be.
Return On Capital Employed (ROCE): What Is It?
Just to clarify if you're unsure, ROCE is a metric for evaluating how much pre-tax income (in percentage terms) a company earns on the capital invested in its business. To calculate this metric for Integrated Diagnostics Holdings, this is the formula:
Return on Capital Employed = Earnings Before Interest and Tax (EBIT) ÷ (Total Assets - Current Liabilities)
0.15 = ج.م637m ÷ (ج.م5.7b - ج.م1.4b) (Based on the trailing twelve months to September 2023).
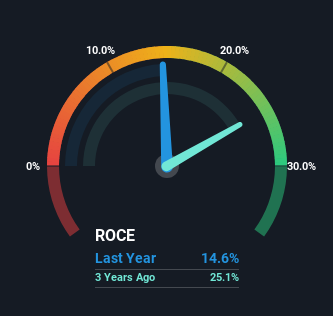
So, Integrated Diagnostics Holdings has an ROCE of 15%. On its own, that's a standard return, however it's much better than the 7.3% generated by the Healthcare industry.
See our latest analysis for Integrated Diagnostics Holdings
In the above chart we have measured Integrated Diagnostics Holdings' prior ROCE against its prior performance, but the future is arguably more important. If you'd like, you can check out the forecasts from the analysts covering Integrated Diagnostics Holdings for free.
What Can We Tell From Integrated Diagnostics Holdings' ROCE Trend?
On the surface, the trend of ROCE at Integrated Diagnostics Holdings doesn't inspire confidence. To be more specific, ROCE has fallen from 24% over the last five years. On the other hand, the company has been employing more capital without a corresponding improvement in sales in the last year, which could suggest these investments are longer term plays. It may take some time before the company starts to see any change in earnings from these investments.
What We Can Learn From Integrated Diagnostics Holdings' ROCE
In summary, Integrated Diagnostics Holdings is reinvesting funds back into the business for growth but unfortunately it looks like sales haven't increased much just yet. Since the stock has declined 59% over the last five years, investors may not be too optimistic on this trend improving either. Therefore based on the analysis done in this article, we don't think Integrated Diagnostics Holdings has the makings of a multi-bagger.
While Integrated Diagnostics Holdings doesn't shine too bright in this respect, it's still worth seeing if the company is trading at attractive prices. You can find that out with our FREE intrinsic value estimation for IDHC on our platform.
If you want to search for solid companies with great earnings, check out this free list of companies with good balance sheets and impressive returns on equity.
Have feedback on this article? Concerned about the content? Get in touch with us directly. Alternatively, email editorial-team (at) simplywallst.com.
This article by Simply Wall St is general in nature. We provide commentary based on historical data and analyst forecasts only using an unbiased methodology and our articles are not intended to be financial advice. It does not constitute a recommendation to buy or sell any stock, and does not take account of your objectives, or your financial situation. We aim to bring you long-term focused analysis driven by fundamental data. Note that our analysis may not factor in the latest price-sensitive company announcements or qualitative material. Simply Wall St has no position in any stocks mentioned.
